

Tour the web app
The web app at app.hud.io shows what Hud has learned about your services, from the whole account down to a single function. This page walks through each area of the web app.
The top bar
Every page shares the same controls at the top:
- Service filter: all services, your favorites, your service groups, or specific services.
- Environment and time frame (the last 7 days by default).
- Filters: narrow the data by tag, such as a deployment ID.
Overview
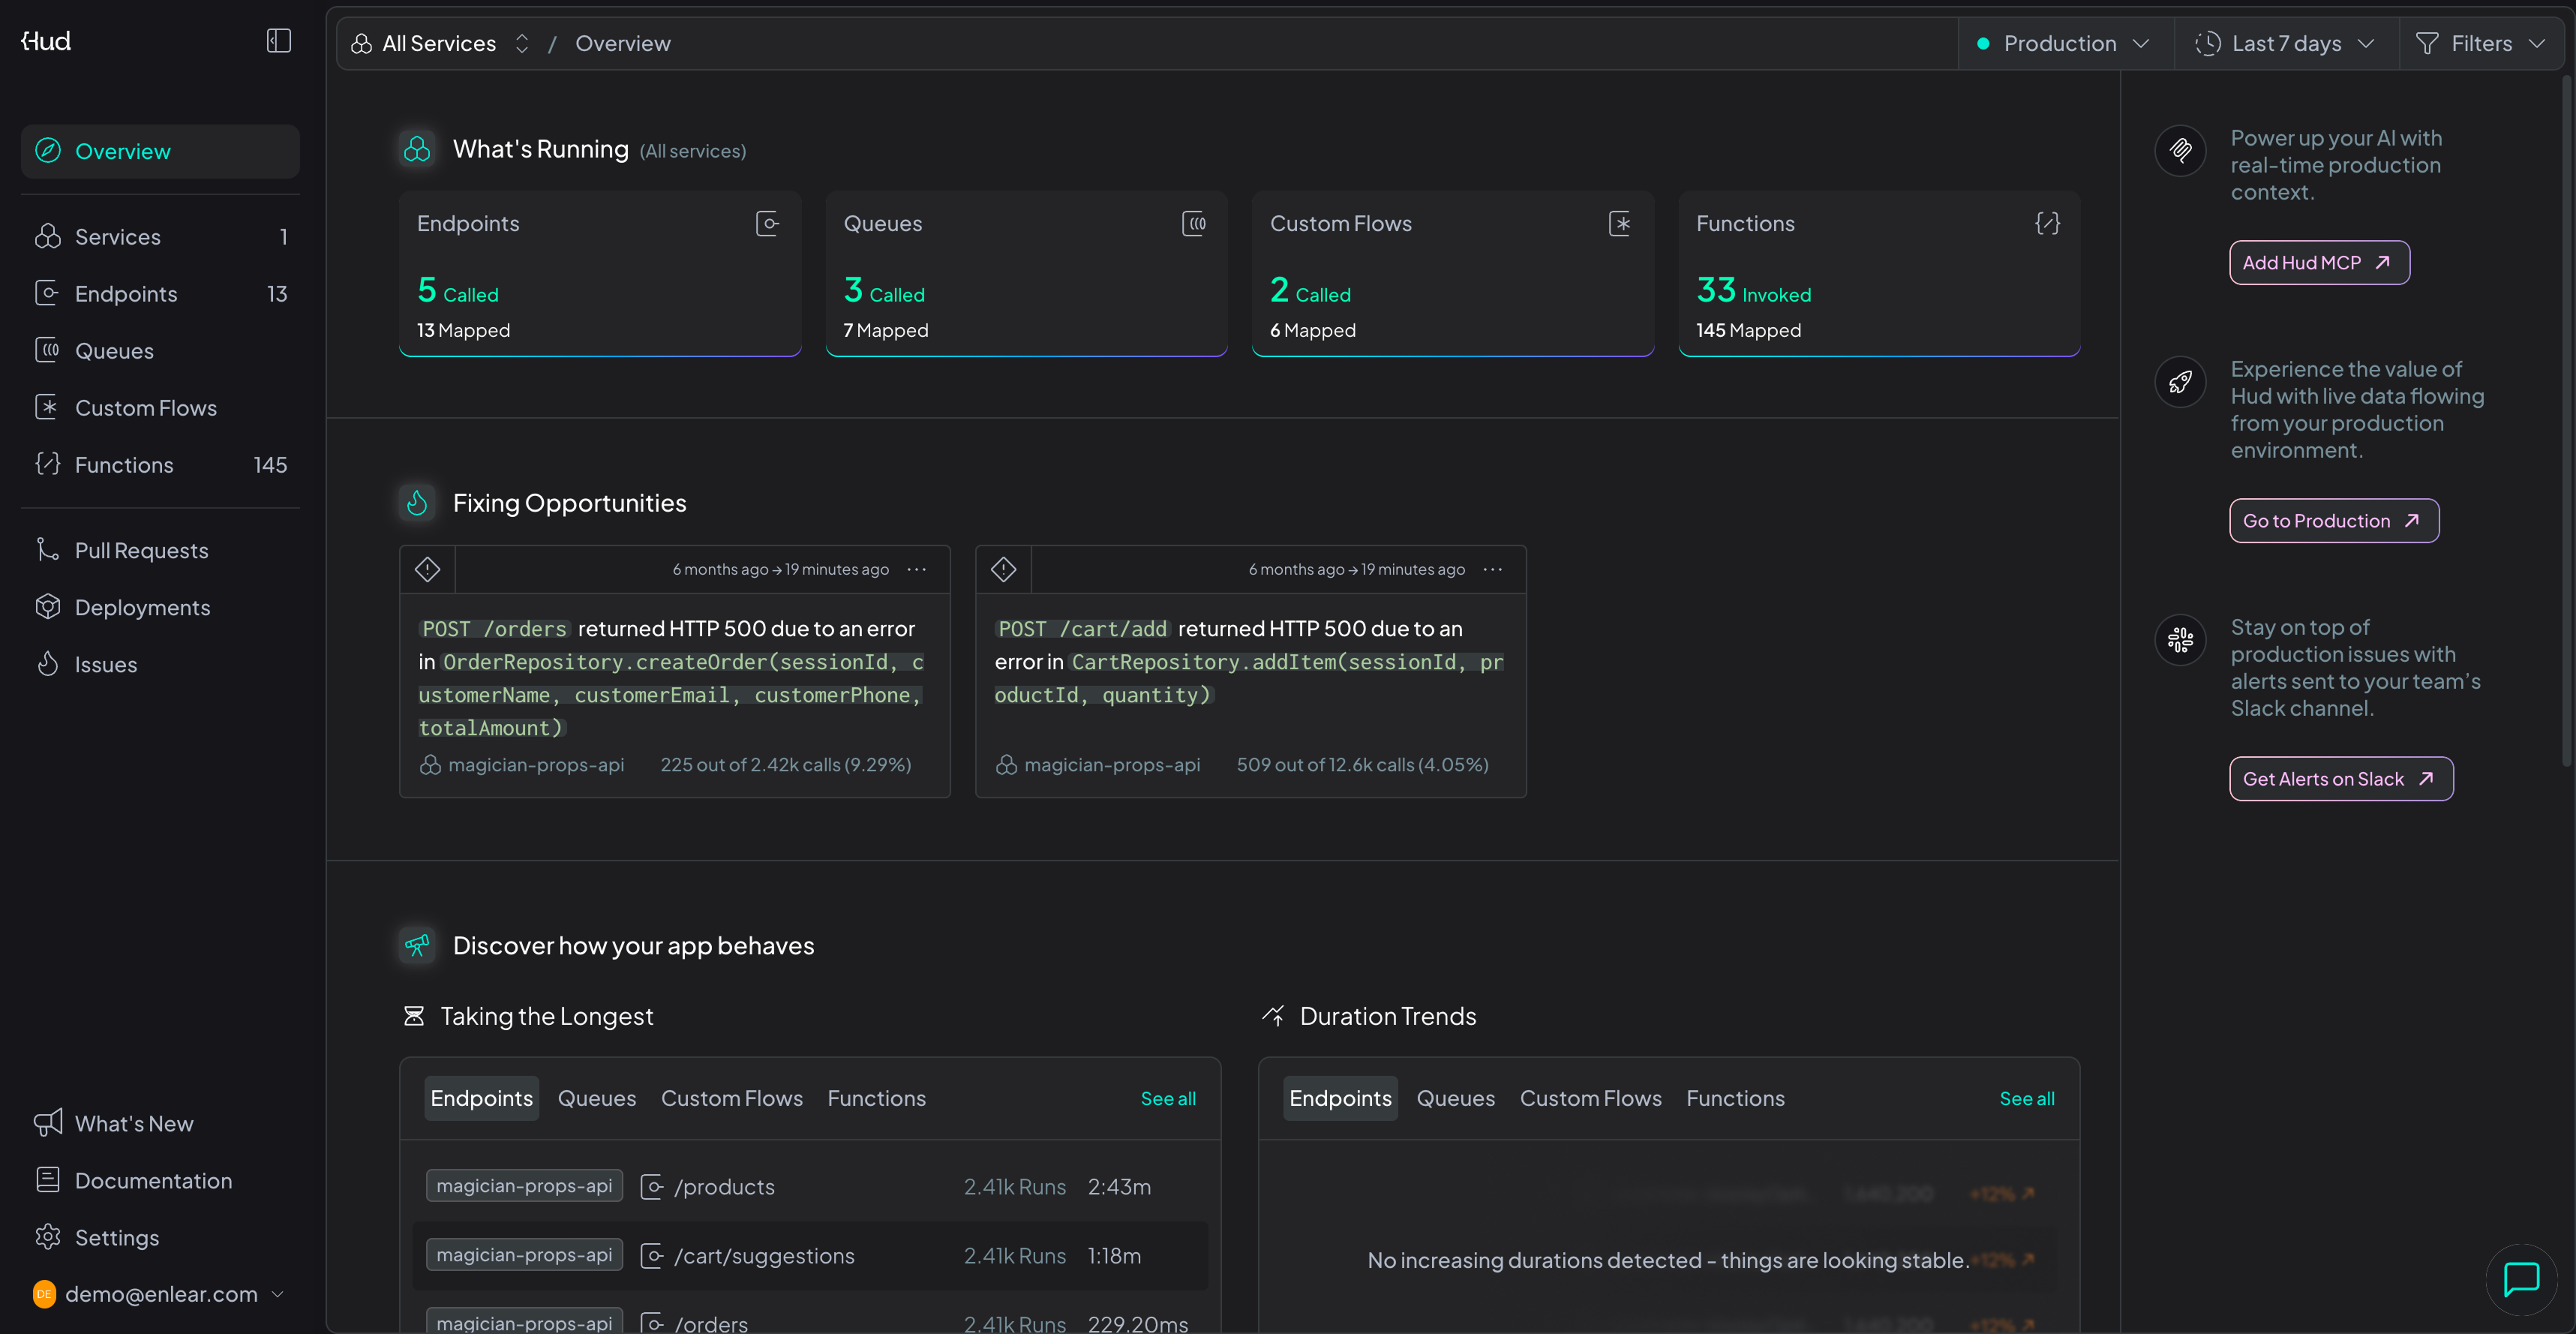
Start here for a summary of your account.
- What's Running: how many endpoints, queues, custom flows and functions Hud has mapped, and how many were called in the time frame.
- Fixing Opportunities: open issues, with how many calls each one affects.
- Discover how your app behaves: what takes the longest, fails the most or is called the most, and which of those are trending up.
Explore
The Explore pages list everything Hud maps: Services, Endpoints, Queues, Custom Flows and Functions. Each list shows runs, error rate and duration, and you can choose its columns and export it to CSV.
Open any row to drill in:
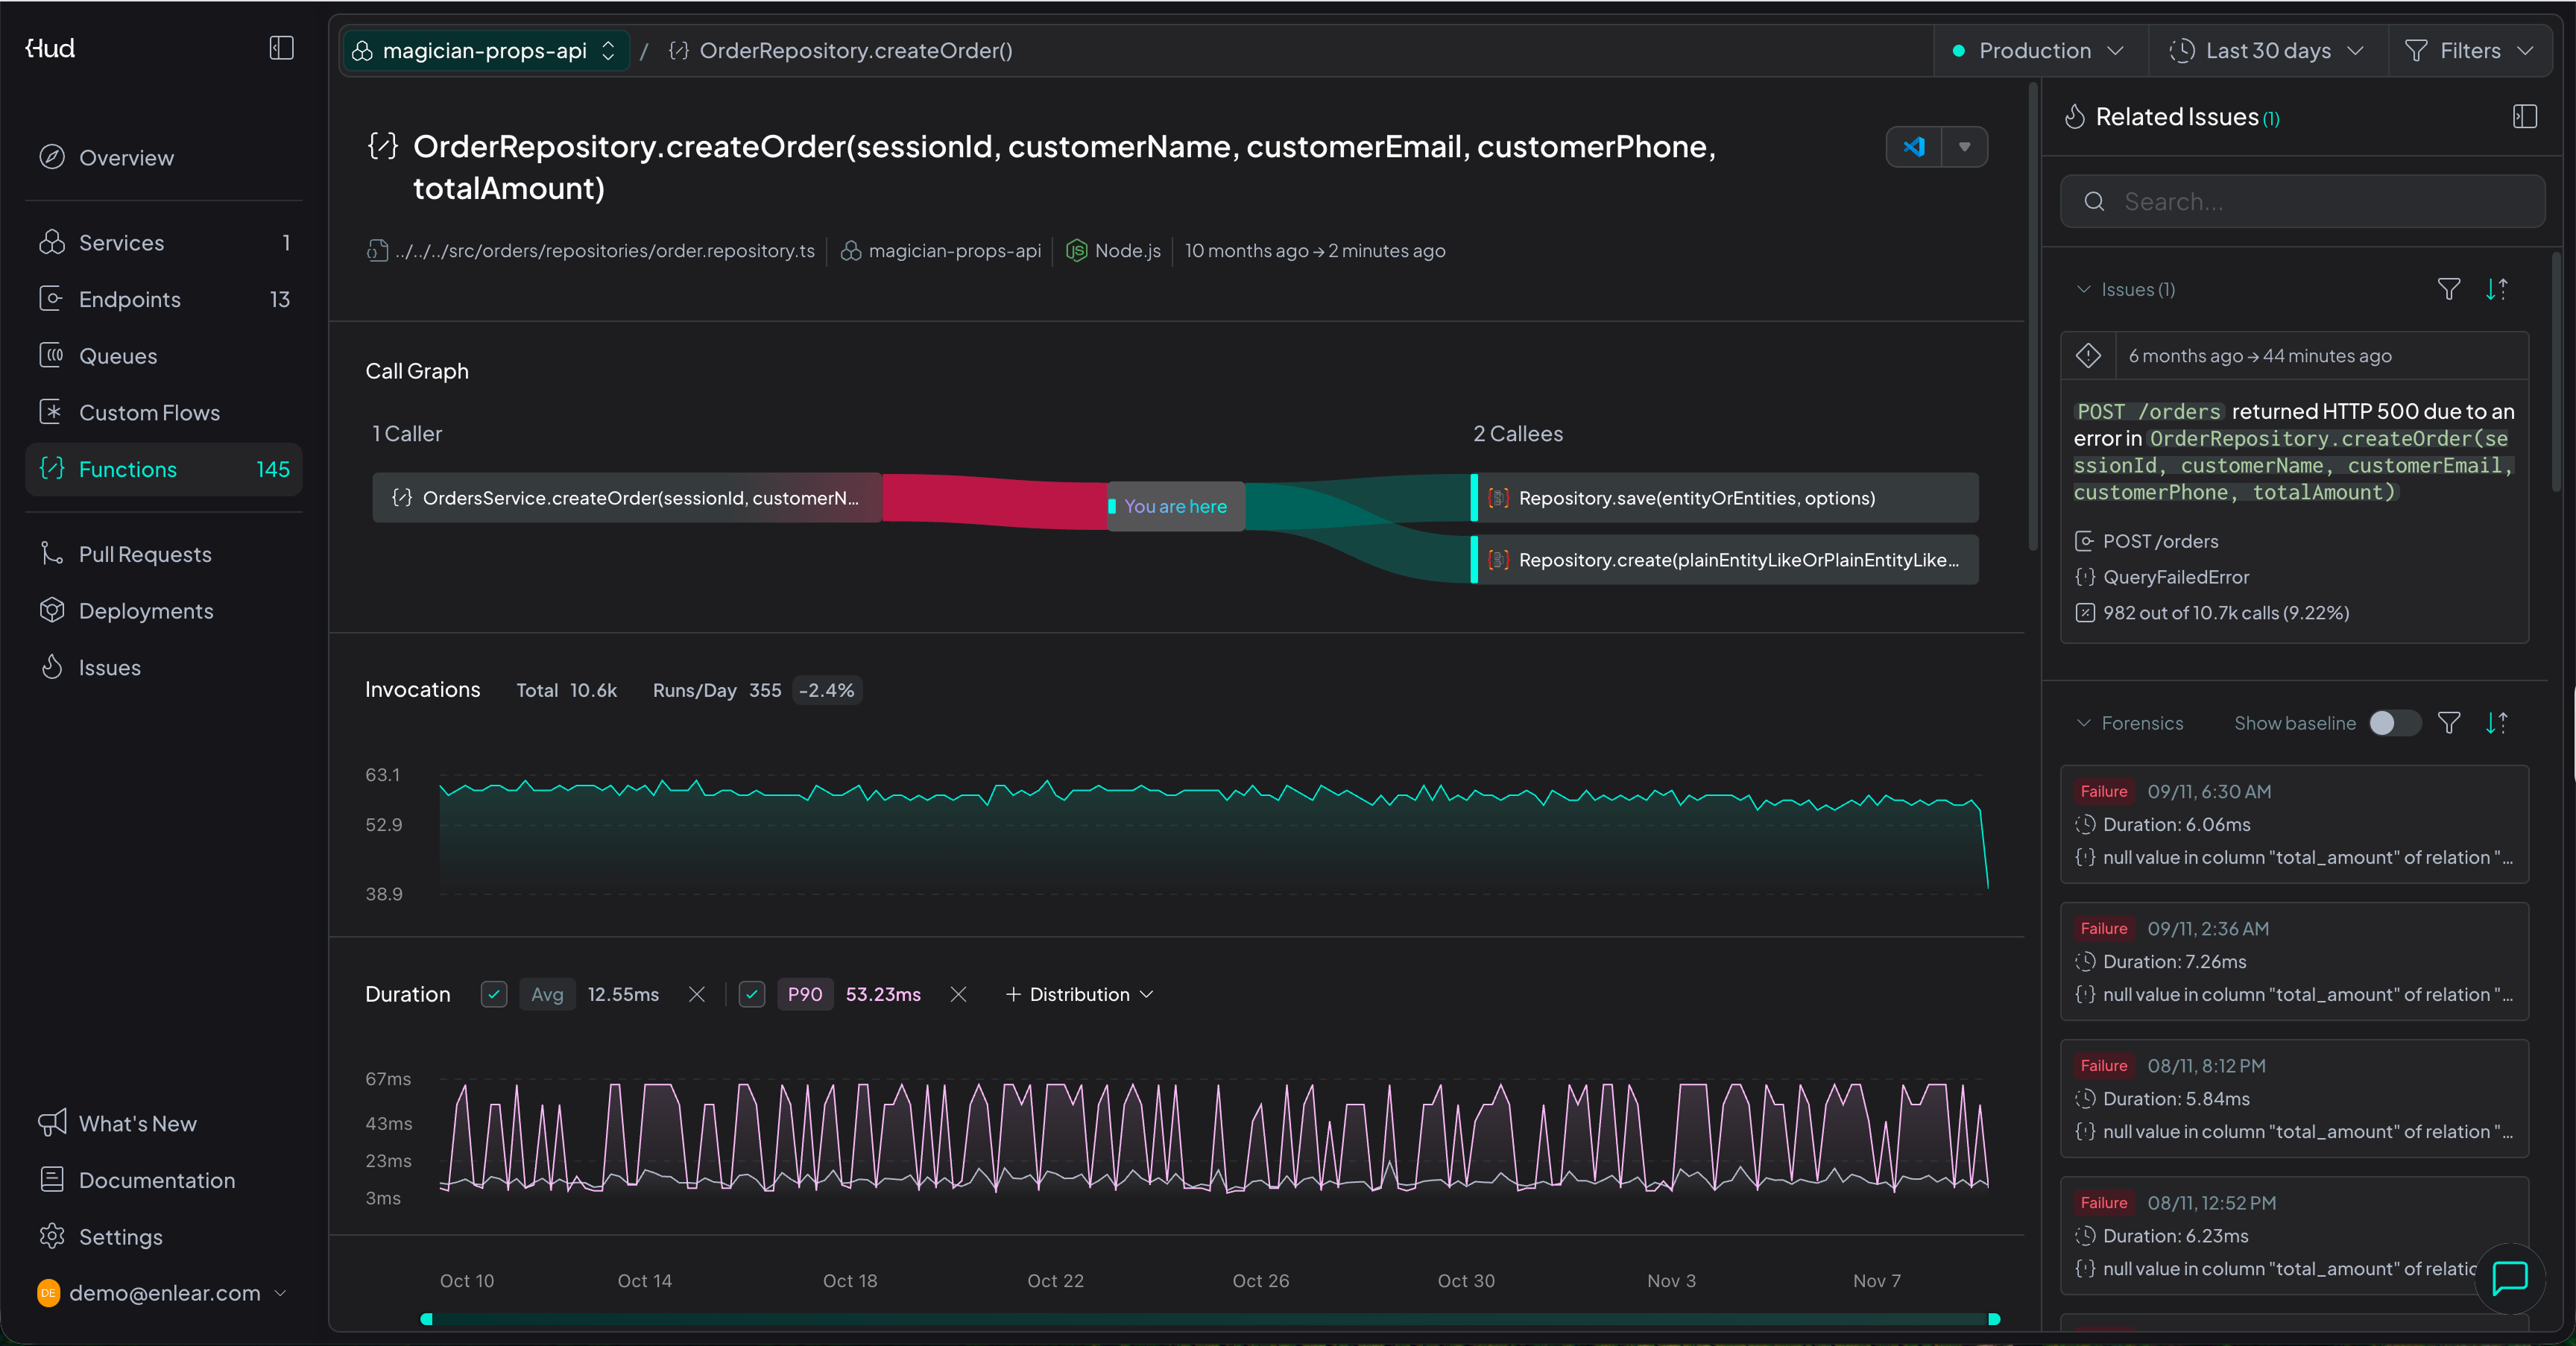
- A service shows invocations, duration, error rate and machine metrics over time, with tabs for its flows, functions and sessions.
- An endpoint or queue adds its status codes and every function that ran in that flow, including when each one last changed.
- A function shows its call graph, what calls it and what it calls, and the errors it threw.
The side panel on each of these pages lists related issues and the latest forensics, so you can open the evidence behind a spike.
Pull Requests
Pull Requests lists the pull requests Hud has reviewed, with the verdict on each: Safe to merge, Review required or High risk. See PR risk check.
Deployments
Every new deployment of your services shows up here with a status: Monitoring, Stable or Failing. Failing deployments are pinned to the top. Open one to see what got worse, the likely PR for each finding, and whether Hud recommends a rollback. See Deployment monitoring.
Issues
Issues lists everything Hud has flagged, with its impact, when it started and its status. Open an issue to see:
- What Happened: the error rate over time, the function where it started, and the forensics Hud captured, including the request, the exception and outbound calls.
- Root Cause and Fix Plan, which fill in when a remediation runs.
- Prompt to Fix, which hands the issue to your coding agent over Hud MCP.
Settings
- Account Usage: how many sessions your account and each service use.
- API Keys: the keys your services use to send data to Hud.
- Integrations: connect Slack for alerts.
- Members: who has access to your account.
- Service Groups: group services by team, each with its own Slack channel.
- MCP Skills: add company context for coding agents, and see the built-in skills Hud MCP uses.
- Heads Up: manage muted and unmonitored endpoints.
- Rules: what Hud flags. There are nine, in two groups: duration performance, such as Post-Deploy Degradation, Latency Spike and SLO Breach, and failure detection, such as Errors, Post-Deploy Error and New Exception Type. Each rule shows whether it's enabled.
- Deployments: connect GitHub and your AI provider for deployment monitoring, choose which services it covers, and set mitigation.
- Agentic Workflows: turn on the PR risk check for each repository and set its reviewer guidelines. This needs an account admin.
Updated about 3 hours ago