Welcome to Hud


Meet Hud

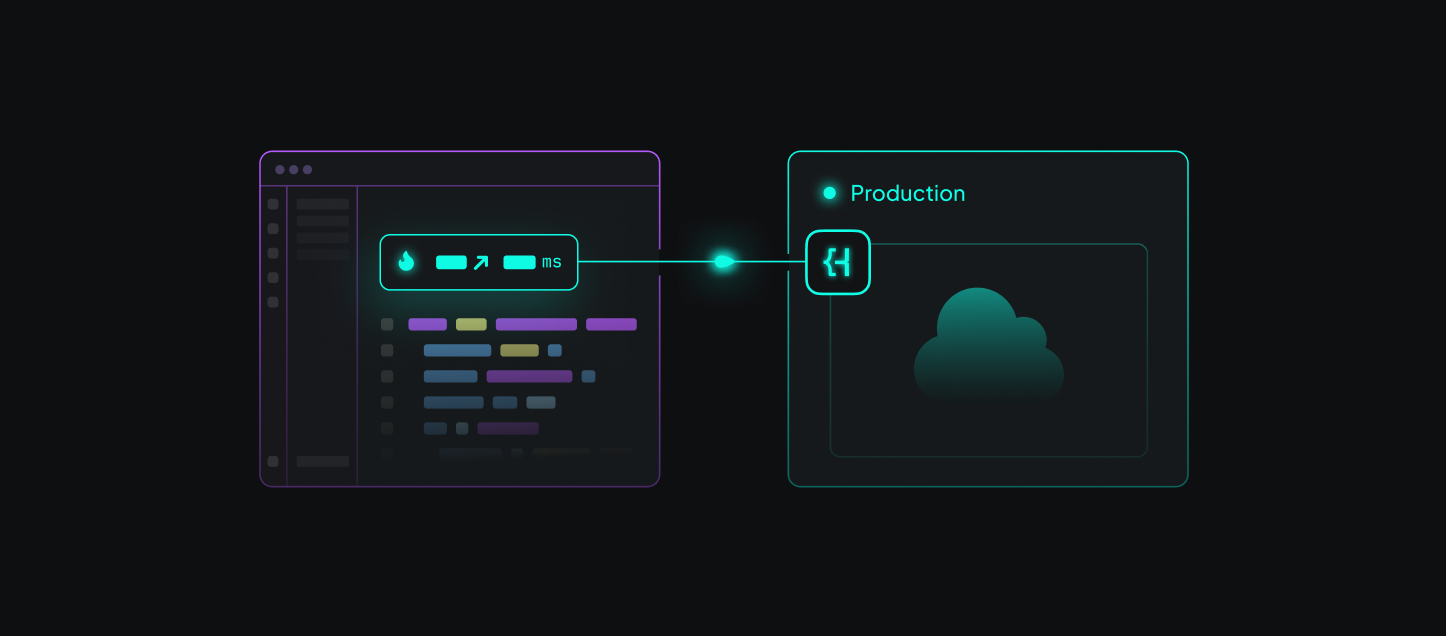
Hud is the first Runtime Code Sensor designed specifically to make AI-generated code production-safe by default. Installed in under a minute with no configuration or dashboards, it streams real-time, function-level runtime data from your live systems directly into your IDE.

Once deployed, Hud tracks how each function behaves in production - mapping execution patterns, surfacing behavioral changes, and delivering structured runtime signals without requiring logs, tracing, or instrumentation.

Hud is purpose-built for engineering teams using code-generating agents like GitHub Copilot, Cursor, or Windsurf - and for teams that need to validate both AI-generated and human-written code against real runtime behavior.

By embedding production context into the development loop, Hud enables developers and agents to reason over live system behavior as they write, review, and deploy code. The result: fewer blind spots, faster validation, and greater confidence in scaling agentic development workflows.


Hud's IDE Extension

Hudders & Hud Panel

Once you've installed Hud's SDK in your service and Hud's IDE extension, headers will appear above each function, which we call "Hudders" (yes, we're fans of wordplay!). These Hudders provide insights into how each function is behaving in production in real-time.

Click on a Hudder to view production insights in the bottom panel.


Call Graph Navigation

In the bottom panel you'll see a call graph based on the code's actual behavior in production. You'll see which functions this function is called from, and which ones it calls. The thickness of the line represents the distribution of calls, and erroneous flows are marked in red. Navigate in your code flow by clicking your function's callers and callees.

Follow the red lines to easily track root causes and how they affect top-level endpoints.


Service Explorer

Get to know how your service behaves in production. Click the Hud icon on the left bar to open the tree-based navigation that allows traversing the codebase from endpoints to the functions they're mapped to, to the functions they call, to the functions they call, etc...


Function Research

For deeper research, scroll down to the bottom of the bottom panel and click "More info". A web page will open with more extensive data about the function's behavior.

Hover to get detailed information. Set your desired time frame using the time picker (top right).


Trending Functions

If you want to see a top-level view of the service's function, hover over the service in the tree on the left and click "Go To All Functions View". There you can do things like sort all functions by which one runs the most, costs the most, or which one has been degrading in performance the most.

Click into any function to further explore, and easily return to that function in VSCode by clicking the VSCode icon.


Environments

You can run hud on local, staging or production. Select the environment from the hud panel, or use the command 'Hud: Switch Env.'


Here’s how to get started

Integrate Hud's SDK

Use our guides at: Hud Node.js Installation or Hud Python Installation to integrate into your application 👷‍♂️

Install Hud's IDE extension

Install our Visual Studio Code extension or Webstorm, Pycharm, IDEA (and more) plugin 🚀


We are here to help!

You can send us any questions or feedback you have on your team's Hud slack channel or at [email protected].