
HudQL API
What is HudQL?
HudQL is Hud's SQL query API. It runs SQL directly against the runtime data Hud collects from your services: endpoint metrics, function metrics, machine metrics, exceptions, and more.
It's the same data layer that powers Hud MCP, exposed as a plain HTTP endpoint so you can call it from anywhere: a script, a coding agent, a Grafana dashboard, or an alerting rule.
Get an API key
Generate a key in Hud > Settings > API Keys. If you don't have one, contact us via the in-app chat and we'll generate one for you.
Quick start
A minimal request to count requests per endpoint over the last hour:
curl -X POST https://api.hud.io/v1/query \
  -H "x-api-key: YOUR_API_KEY" \
  -H "Content-Type: application/json" \
  -d '{
    "query": "SELECT e.endpoint_name, SUM(m.invocations) AS requests FROM EndpointMetricsLowResolution m JOIN Endpoints e ON m.endpoint_id = e.endpoint_id WHERE m.hour_end >= now() - INTERVAL 1 HOUR GROUP BY e.endpoint_name ORDER BY requests DESC LIMIT 10",
    "service_names": ["my-service"]
  }'
API reference
Full OpenAPI definition: executeQuery reference.
Endpoint: POST https://api.hud.io/v1/query
Authentication: Pass your API key in the x-api-key header.
Request body
| Field | Type | Required | Description |
|---|---|---|---|
query | string | yes | The HudQL (SQL) statement to run. ClickHouse SQL syntax. |
service_names | string[] | no | Restrict the query to specific services. If omitted, queries all services your key can access. Recommended for performance. |
environment | string | no | Filter by environment. Defaults to production. Pass an empty string ("") to query across all environments (in that case, include environment_name in your GROUP BY / SELECT). |
Response
The response is a JSON object with a row array and column metadata:
{
  "columns": [
    { "name": "endpoint_name", "type": "String" },
    { "name": "requests", "type": "UInt64" }
  ],
  "rows": [
    ["GET /api/users", 1423],
    ["POST /api/orders", 891]
  ]
}
CSV is also available for use with tools that prefer tabular input (Grafana Infinity datasource, for example). See the Grafana section below.
Errors
| Status | Meaning | Common cause |
|---|---|---|
| 400 | Bad request | Invalid SQL syntax, unknown table or column |
| 401 | Unauthorized | Missing or invalid x-api-key |
| 403 | Forbidden | Key doesn't have access to the requested service |
| 429 | Rate limited | Too many requests; back off and retry |
| 500 | Server error | Reach out via support chat |
Schema basics
HudQL runs on ClickHouse and is organized around two time resolutions:
- High resolution (per-session, minute-level):
EndpointMetricsHighResolution,FunctionMetricsHighResolution. Use for short windows (minutes to a few hours). - Low resolution (hourly, aggregated across sessions):
EndpointMetricsLowResolution,FunctionMetricsLowResolution. Use for ranges of 10+ hours.
For the full catalog (every table, column, deployment tracking, machine metrics, forensic traces, etc.), ask your coding agent to use the
hud-get-schematool in Hud MCP. The summary below covers the tables you need to get started.
Core tables
EndpointMetricsLowResolution — hourly endpoint rollups.
| Column | Type | Notes |
|---|---|---|
hour_end | DateTime | Bucket boundary (UTC) |
service_name | String | |
environment_name | String | production, staging, etc. |
endpoint_id | UInt32 | Join key to Endpoints |
endpoint_type | String | HTTP, KAFKA, SQS, GRAPHQL, ARQ, etc. |
invocations | UInt64 | Requests in the bucket |
msg_count | UInt64 | Message count (queues) |
total_duration_ms | Float64 | Sum of durations |
duration_buckets | AggregateFunction | Pre-aggregated histogram. Use with percentileMS() |
status_codes | Map(String, Float64) | HTTP status distribution, e.g. {"200": 120, "503": 4} |
exceptions | Map(String, Float64) | Error counts by type (queues, GraphQL) |
fingerprints | Map(String, UInt64) | Error fingerprint counts |
Endpoints — endpoint metadata. Join on endpoint_id for readable names.
| Column | Type | Notes |
|---|---|---|
endpoint_id | UInt32 | |
endpoint_name | String | HTTP path, Kafka topic, SQS queue name, etc. |
type | String | HTTP, KAFKA, SQS, GRAPHQL, ARQ, etc. |
http_methods | Array(String) | e.g. ['GET', 'POST'] |
services | Array(Tuple(UInt32, String)) | (service_id, service_name) pairs |
FunctionMetricsLowResolution — hourly function-level rollups. Same metric columns as the endpoint table, plus function_id, caller_function_id, and wrapped_endpoint_id. This is the function-level depth that distinguishes Hud from endpoint-only tools.
Functions — function metadata (signature, file, line numbers). Join on function_id.
Custom functions
| Function | Description |
|---|---|
percentileMS(duration_buckets, p) | Extracts the p-th percentile latency in ms from a histogram column. e.g. percentileMS(duration_buckets, 95) for P95. |
function_error_rate(exceptions, invocations) | Computes function error rate from the exceptions map and invocation count. |
endpoint_error_rate(endpoint_type, exceptions, status_codes, invocations, msg_count) | Computes endpoint error rate, handling HTTP status codes and queue exceptions correctly. |
Important quirks
- Each row is an aggregation, not a single call. Use
SUM(invocations), notCOUNT(*). - Don't prefix tables with the database name (
Endpoints, nothud.Endpoints). - The
Forensicstable column isfingerprint(singular, String); metrics tables usefingerprints(plural, Map). - All non-aggregated columns must appear in
GROUP BY.
Common queries
P90 latency per endpoint, last 24 hours
SELECT
  e.endpoint_name,
  SUM(m.invocations) AS requests,
  percentileMS(m.duration_buckets, 90) AS p90_ms
FROM EndpointMetricsLowResolution m
JOIN Endpoints e ON m.endpoint_id = e.endpoint_id
WHERE m.hour_end >= now() - INTERVAL 24 HOUR
GROUP BY e.endpoint_name, m.endpoint_id
ORDER BY p90_ms DESC
LIMIT 20
Endpoint error rate, last 2 hours
SELECT
  e.endpoint_name,
  SUM(m.invocations) AS requests,
  endpoint_error_rate(
    m.endpoint_type,
    sumMap(m.exceptions),
    sumMap(m.status_codes),
    sum(m.invocations),
    sum(m.msg_count)
  ) AS error_rate
FROM EndpointMetricsLowResolution m
JOIN Endpoints e ON m.endpoint_id = e.endpoint_id
WHERE m.hour_end >= now() - INTERVAL 2 HOUR
GROUP BY m.endpoint_id, e.endpoint_name, m.endpoint_type
ORDER BY error_rate DESC
LIMIT 20
Request volume over time (hourly)
SELECT
  hour_end AS time,
  SUM(invocations) AS requests
FROM EndpointMetricsLowResolution
WHERE hour_end >= now() - INTERVAL 7 DAY
GROUP BY hour_end
ORDER BY time ASC
Top exception types across endpoints, last hour
SELECT
  exception_type,
  SUM(count) AS occurrences
FROM EndpointMetricsLowResolution
ARRAY JOIN
  mapKeys(exceptions) AS exception_type,
  mapValues(exceptions) AS count
WHERE hour_end >= now() - INTERVAL 1 HOUR
GROUP BY exception_type
ORDER BY occurrences DESC
LIMIT 10
Grafana integration
HudQL returns standard JSON/CSV over HTTP, so you can connect it to Grafana with the Infinity datasource plugin.
1. Install the Infinity plugin
In Grafana, go to Administration > Plugins, search for Infinity (yesoreyeram-infinity-datasource), and install it.
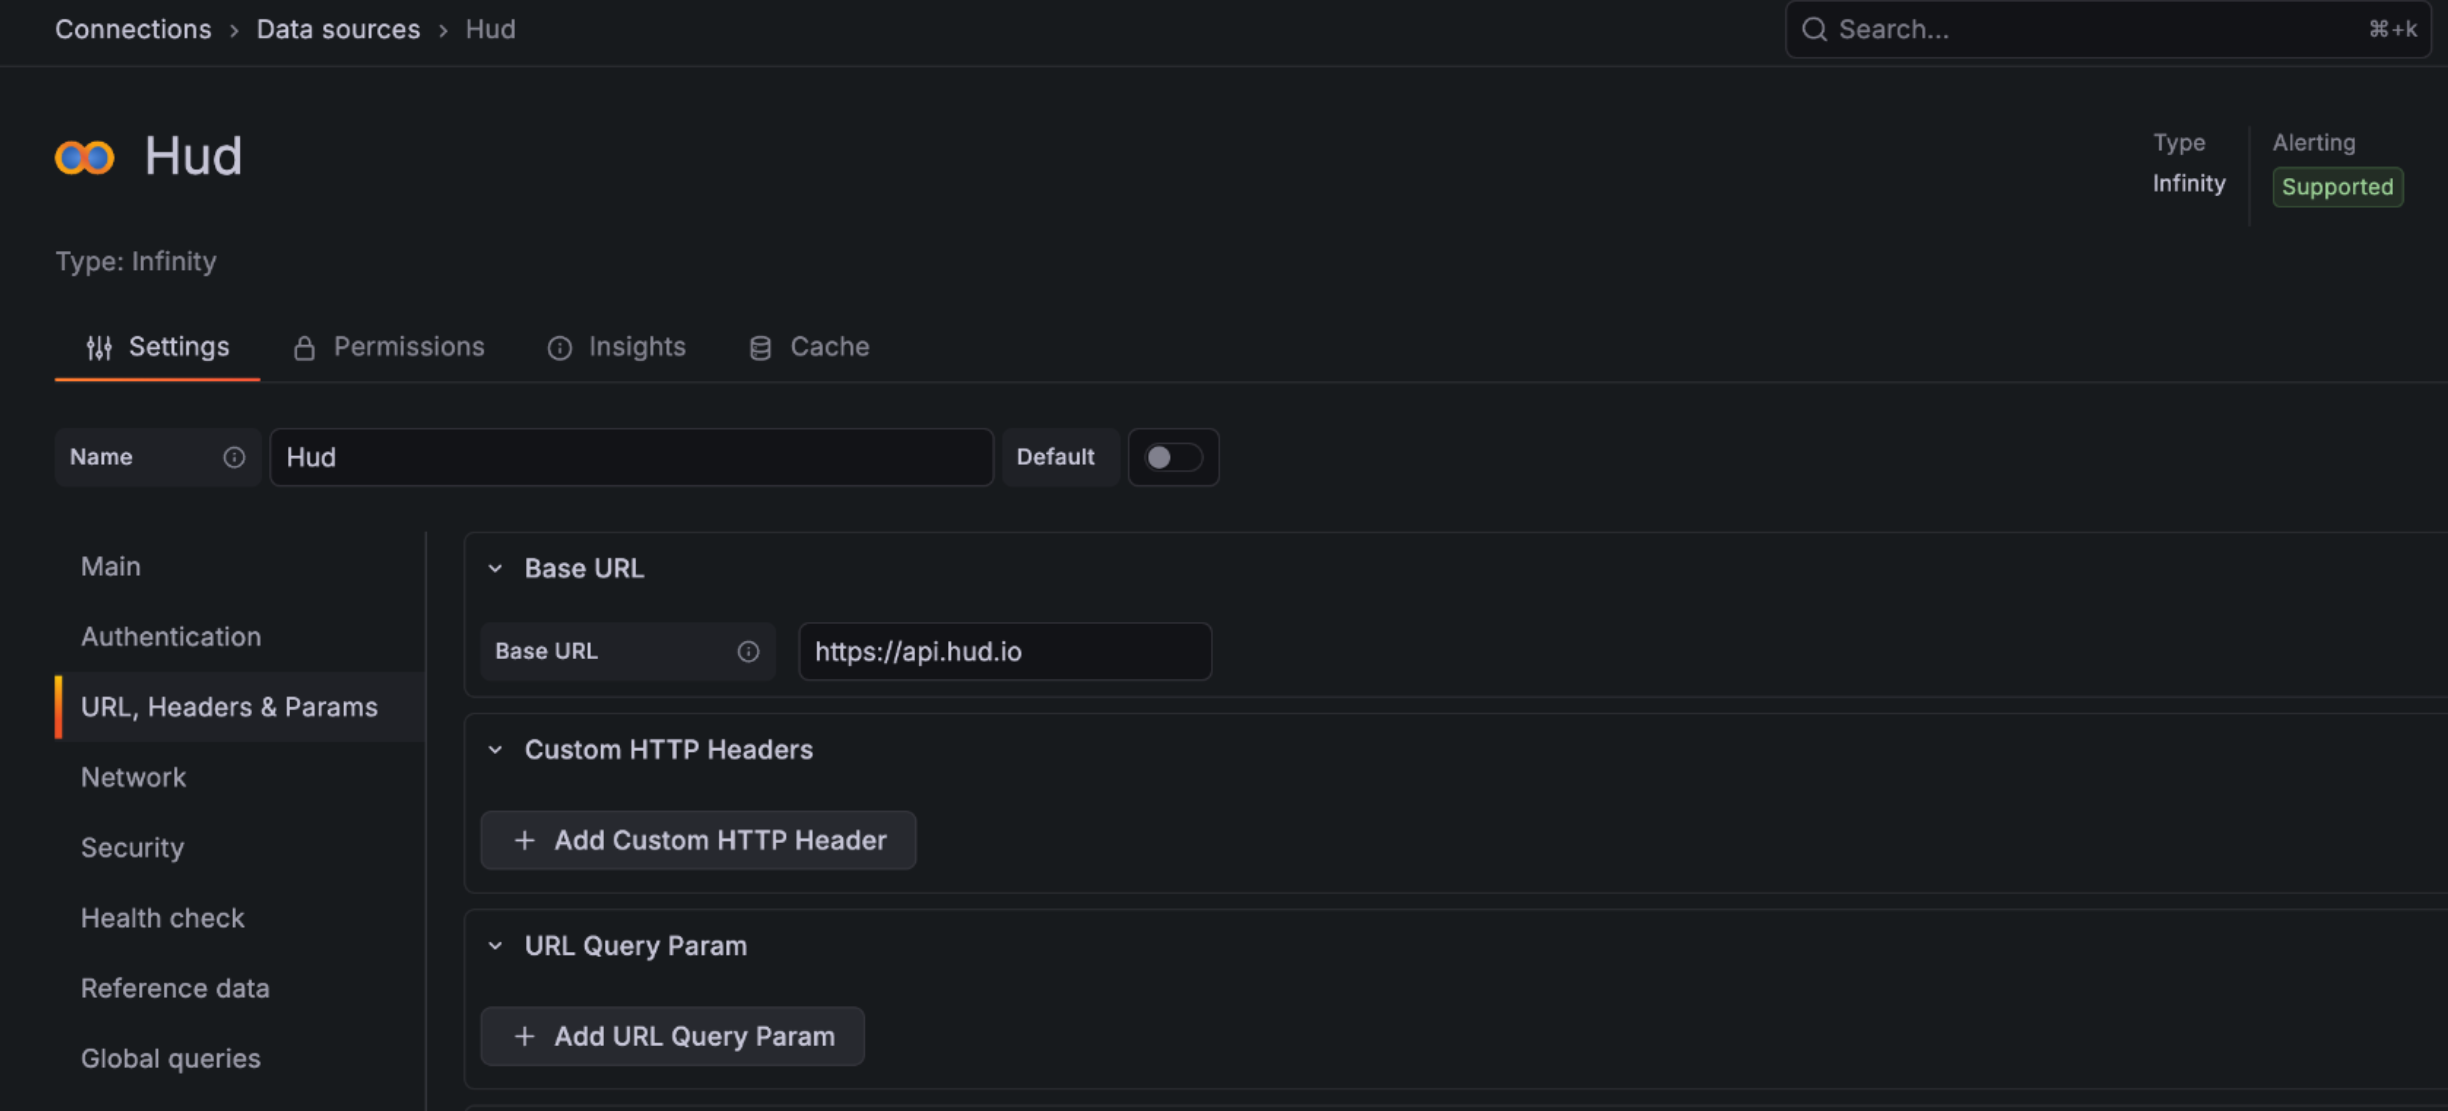
2. Add the datasource
Go to Connections > Data sources > Add data source, select Infinity, and configure:
- Name:
Hud(or any name you prefer) - URL:
https://api.hud.io
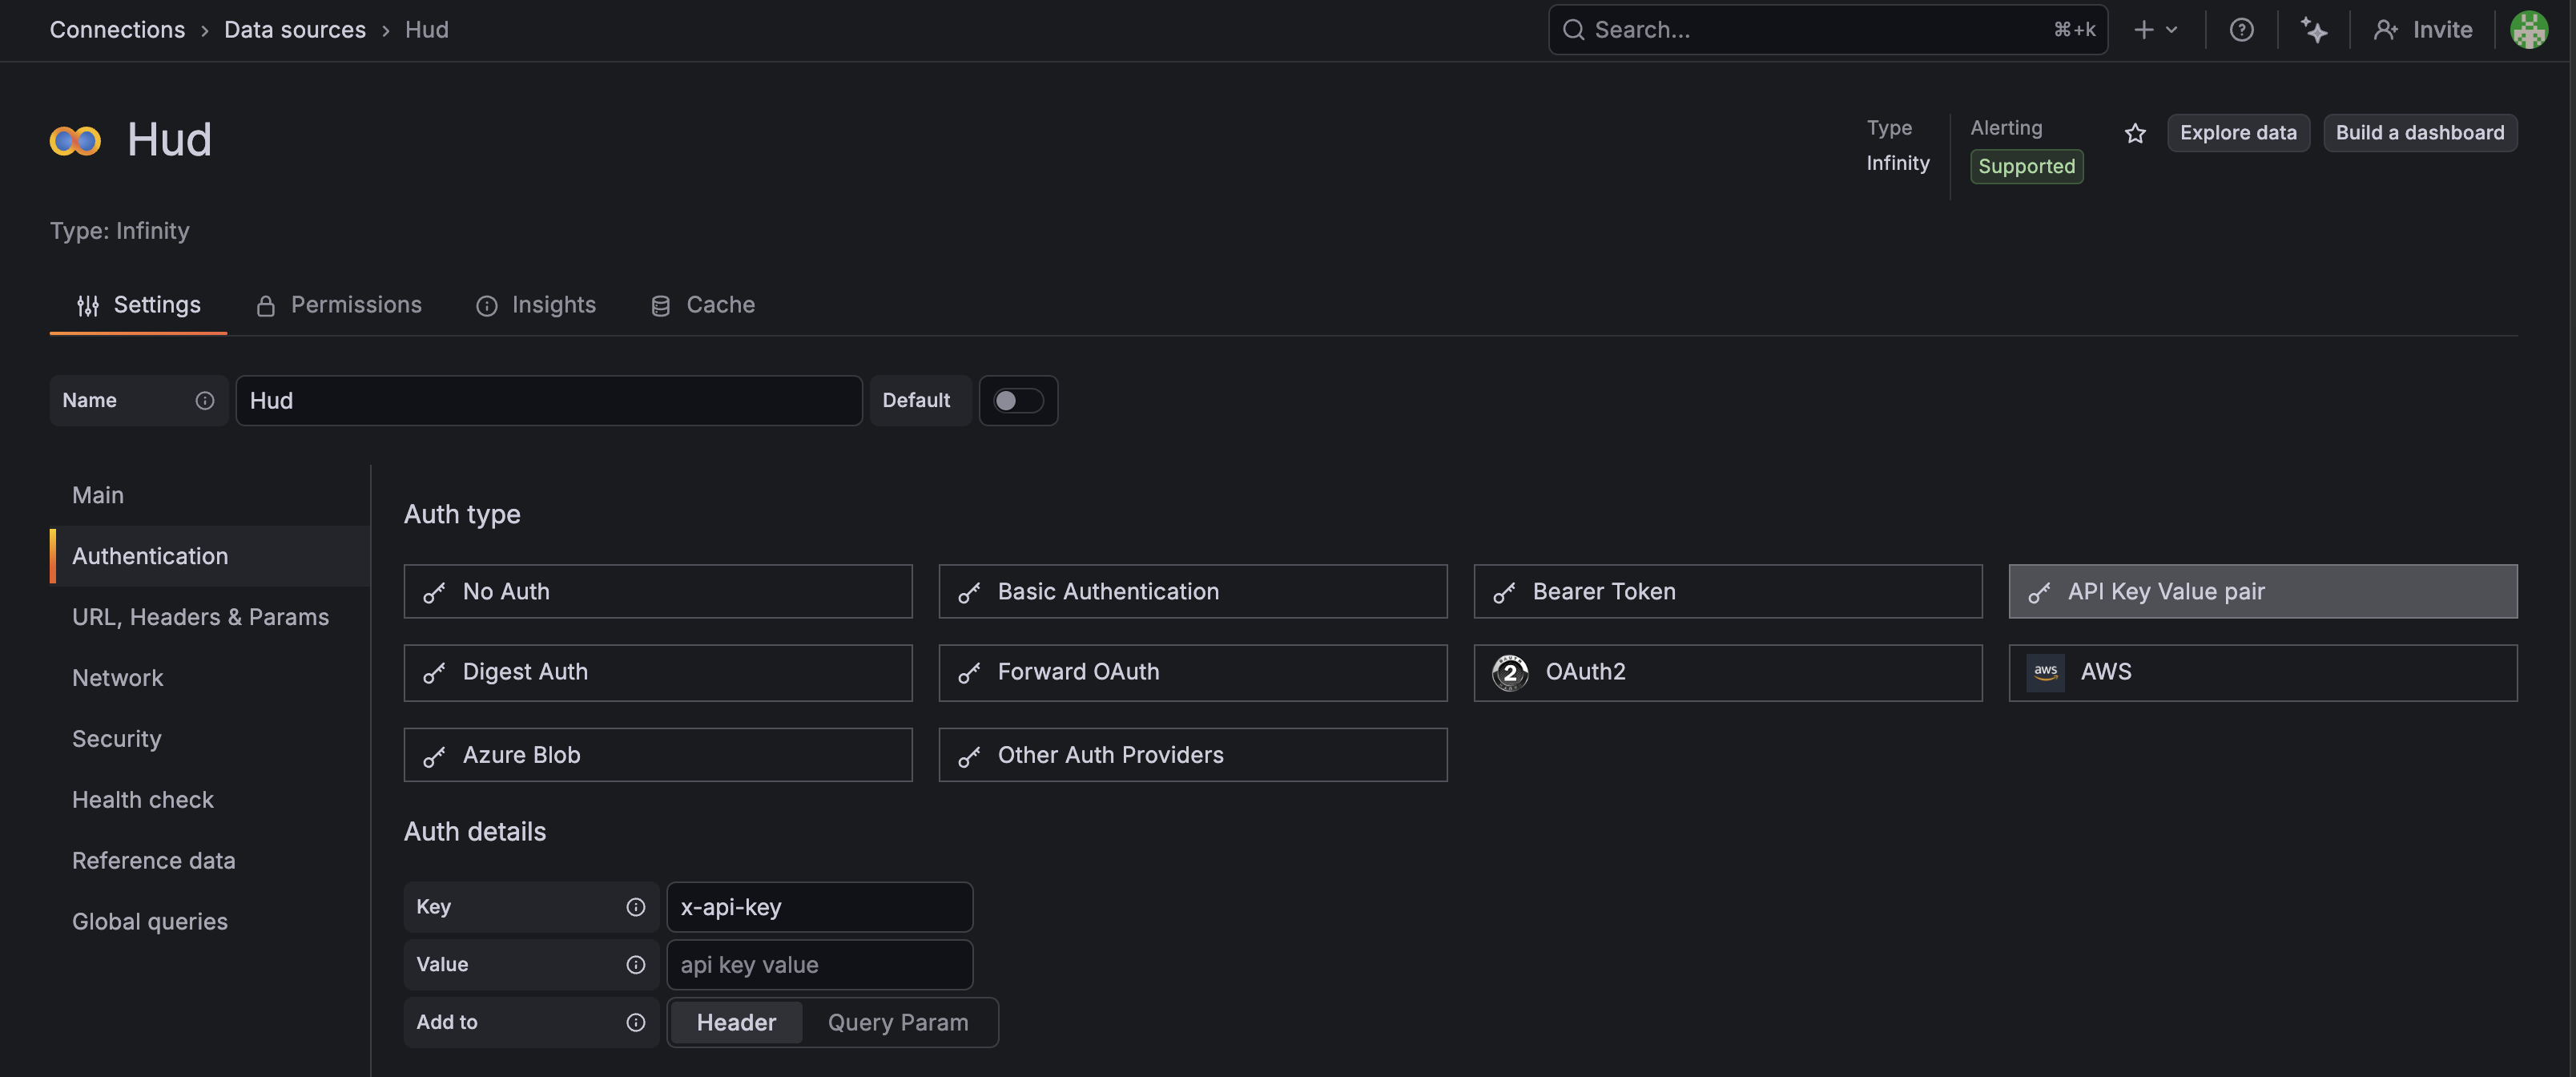
3. Configure authentication
Under Authentication, select API Key Value pair and add:
- Key:
x-api-key - Value: Your Hud API key
- Add to: Header
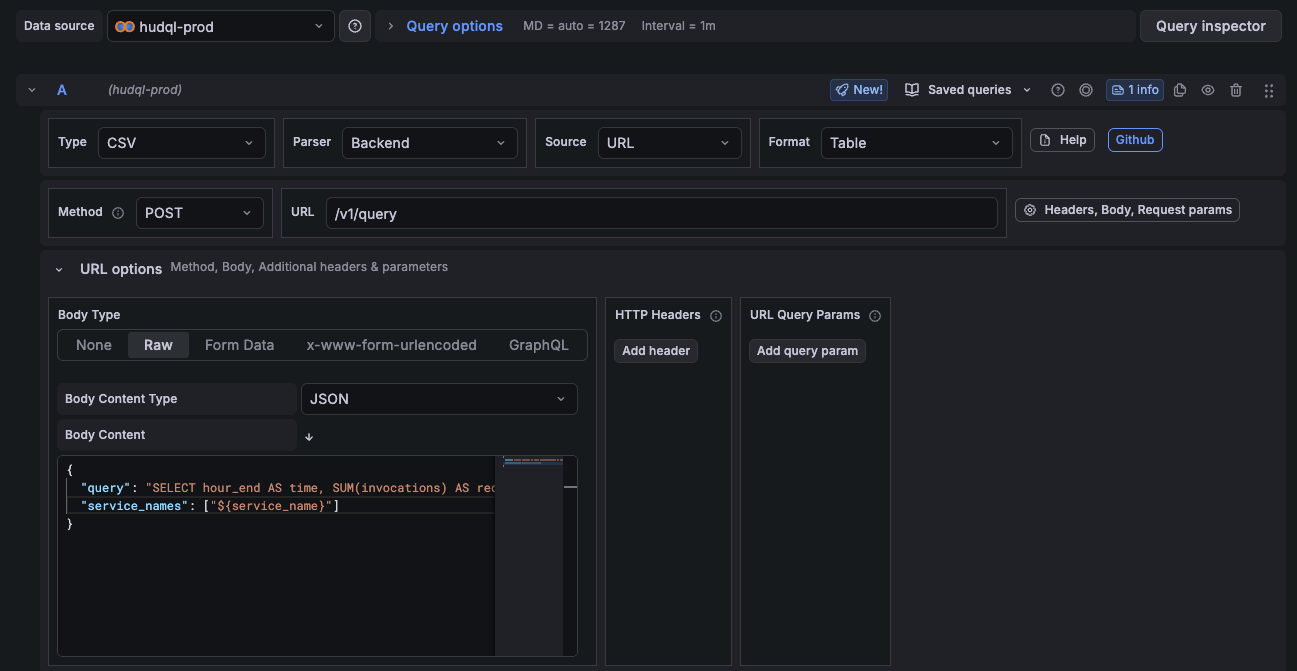
4. Configure a query panel
| Setting | Value |
|---|---|
| Type | CSV |
| Parser | Backend |
| Source | URL |
| URL | /v1/query |
| Method | POST |
| Body type | Raw |
| Body content type | JSON (application/json) |
In the body, send your HudQL query. Use Grafana's built-in ${__from} and ${__to} variables for time range binding:
{
  "query": "SELECT hour_end AS time, SUM(invocations) AS requests FROM EndpointMetricsLowResolution WHERE hour_end >= toDateTime('${__from:date:YYYY-MM-DD HH:mm:ss}') AND hour_end <= toDateTime('${__to:date:YYYY-MM-DD HH:mm:ss}') GROUP BY hour_end ORDER BY time ASC LIMIT 10000",
  "service_names": ["${service_name}"]
}
Define columns in the Infinity query editor to map types correctly (e.g. time as timestamp, requests as number).
Template variable for service name
Create a service_name dashboard variable by querying distinct services:
{
  "query": "SELECT DISTINCT service_name FROM EndpointMetricsLowResolution WHERE hour_end >= toDateTime('${__from:date:YYYY-MM-DD HH:mm:ss}') AND hour_end <= toDateTime('${__to:date:YYYY-MM-DD HH:mm:ss}') ORDER BY service_name LIMIT 100"
}
Build a dashboard with Hud's data
Use the prompt below with your coding agent (Cursor, Claude, etc.) to generate a full Grafana dashboard JSON. Paste the output into a new dashboard via Settings > JSON Modal.
Use the Hud MCP hud-get-schema tool to understand the full HudQL database schema (tables, columns, custom SQL functions, and query examples).
Then create a Grafana dashboard JSON using the Infinity datasource. Include $datasource and $service_name template variables.
Template variables:
// 1. Datasource selector (type: "datasource")
{ "name": "datasource", "type": "datasource", "query": "yesoreyeram-infinity-datasource" }
// 2. Service name (type: "query"), note the queryType/infinityQuery wrapper
{
"name": "service_name",
"type": "query",
"datasource": { "type": "yesoreyeram-infinity-datasource", "uid": "${datasource}" },
"query": {
"queryType": "infinity",
"infinityQuery": {
"refId": "variable",
"type": "csv", "parser": "backend", "source": "url", "format": "table",
"url": "/v1/query",
"url_options": {
"method": "POST", "body_type": "raw", "body_content_type": "application/json",
"data": "{\"query\": \"SELECT DISTINCT service_name FROM EndpointMetricsLowResolution ORDER BY service_name LIMIT 100\"}"
},
"columns": [{ "selector": "service_name", "text": "service_name", "type": "string" }],
"filters": [], "root_selector": "", "global_query_id": ""
}
}
}
Every panel target must use this exact structure:
{
"datasource": { "type": "yesoreyeram-infinity-datasource", "uid": "${datasource}" },
"refId": "A",
"type": "csv",
"parser": "backend",
"source": "url",
"format": "table",
"url": "/v1/query",
"url_options": {
"method": "POST",
"body_type": "raw",
"body_content_type": "application/json",
"data": "{\"query\": \"SELECT ...\", \"service_names\": [\"${service_name}\"]}"
},
"columns": [
{ "selector": "col_alias", "text": "Display Name", "type": "timestamp|number|string" }
],
"filters": [],
"root_selector": "",
"global_query_id": ""
}
Critical details:
- The POST body key is `data`, NOT `body`. Using `body` causes 400 errors.
- Every target must include `filters: []`, `root_selector: ""`, `global_query_id: ""`.
- Use `"uid": "${datasource}"` everywhere, never hardcode a datasource UID.
- Time range: `toDateTime('${__from:date:YYYY-MM-DD HH:mm:ss}')` and same for `${__to}`.
- Time series: alias the time column as `time`. For per-endpoint series, add a `partitionByValues` transformation referencing the column's text (display name), with `"naming": { "asLabels": true }`.
- Stat panels: `reduceOptions.fields` as regex like `/^total_requests$/`, `calcs: ["lastNotNull"]`. Stat panel columns can be `[]`.
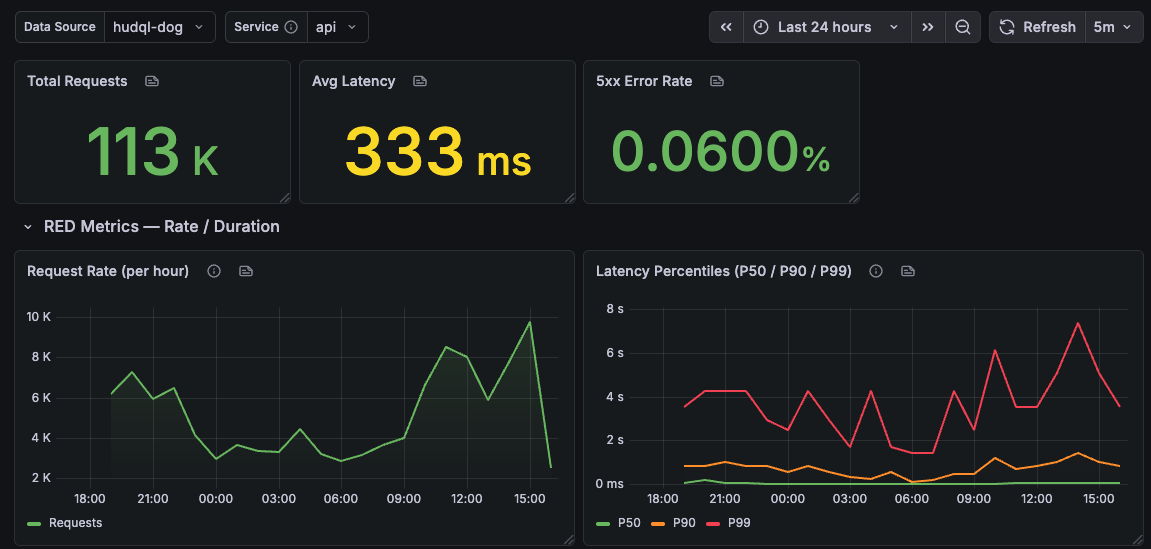
Panels: summary stats (total requests, avg latency, 5xx rate, active pods), time series (request rate, P50/P90/P99 latency), P90 per endpoint over time, drill-down tables (top endpoints by P99, top exceptions). Use `EndpointMetricsLowResolution` for metrics, join `Endpoints` for names.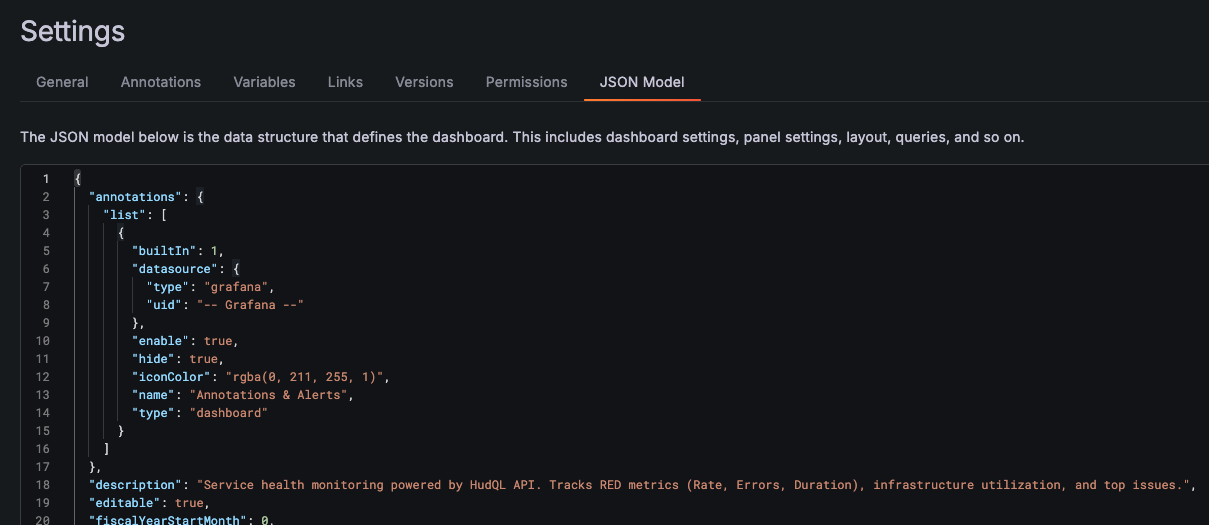
The result:
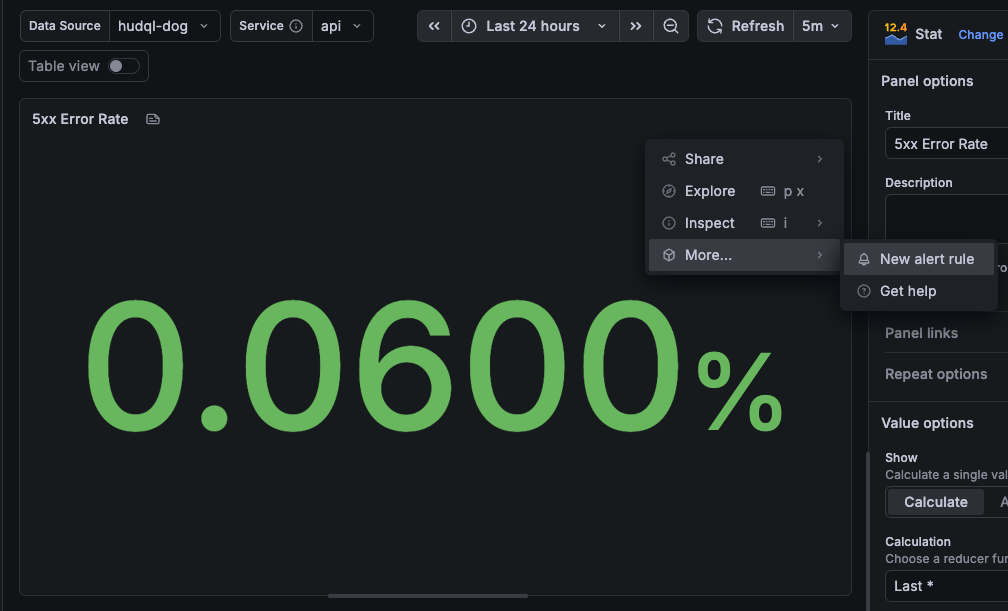
Set up alerts
Once a dashboard is in place, you can alert on any panel: click the panel's three-dot menu, choose More > New alert rule, and configure your alert logic against the underlying HudQL query.
Troubleshooting and support
- Schema discovery: Use the
hud-get-schematool in Hud MCP for the complete table and column catalog with query examples. - Query errors: A 400 response includes the underlying SQL error message. Check column names and table joins first.
- Need help? Open the in-app support chat and we'll jump in.