Summary

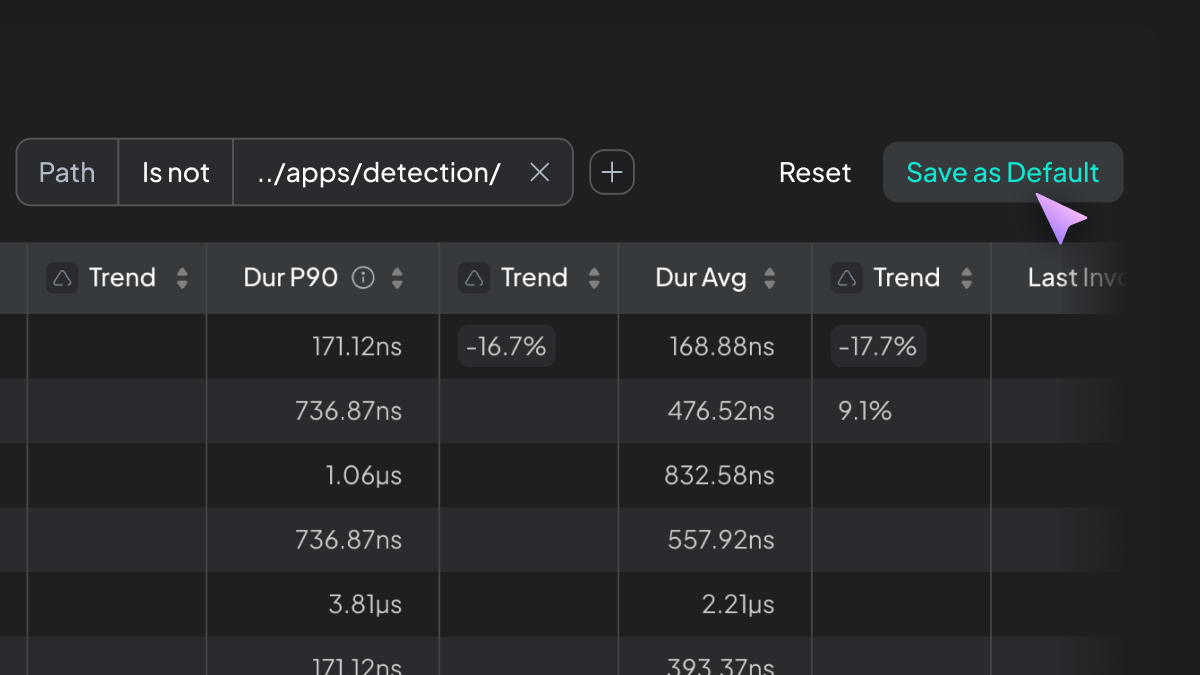
You can now save your preferred filters as defaults and use new exclusion filters to keep irrelevant data out of view. These updates help you start every session with a clear, focused workspace.

Details

  • Persistent filters: Use "Save as Default" to store your current filter set as your personal default for each table.
  • New "Not" filters: Exclude specific folders, files, or paths across Endpoints, Functions, Queues, and Services.

Why It Matters

These improvements reduce repetitive setup and help you concentrate on the endpoints, functions, and queues that are actually relevant to your investigation. You get a consistent, streamlined view every time you return to Hud.

How to Access

Open any table, set your filters, and select "Save as Default" to make them persistent across sessions.


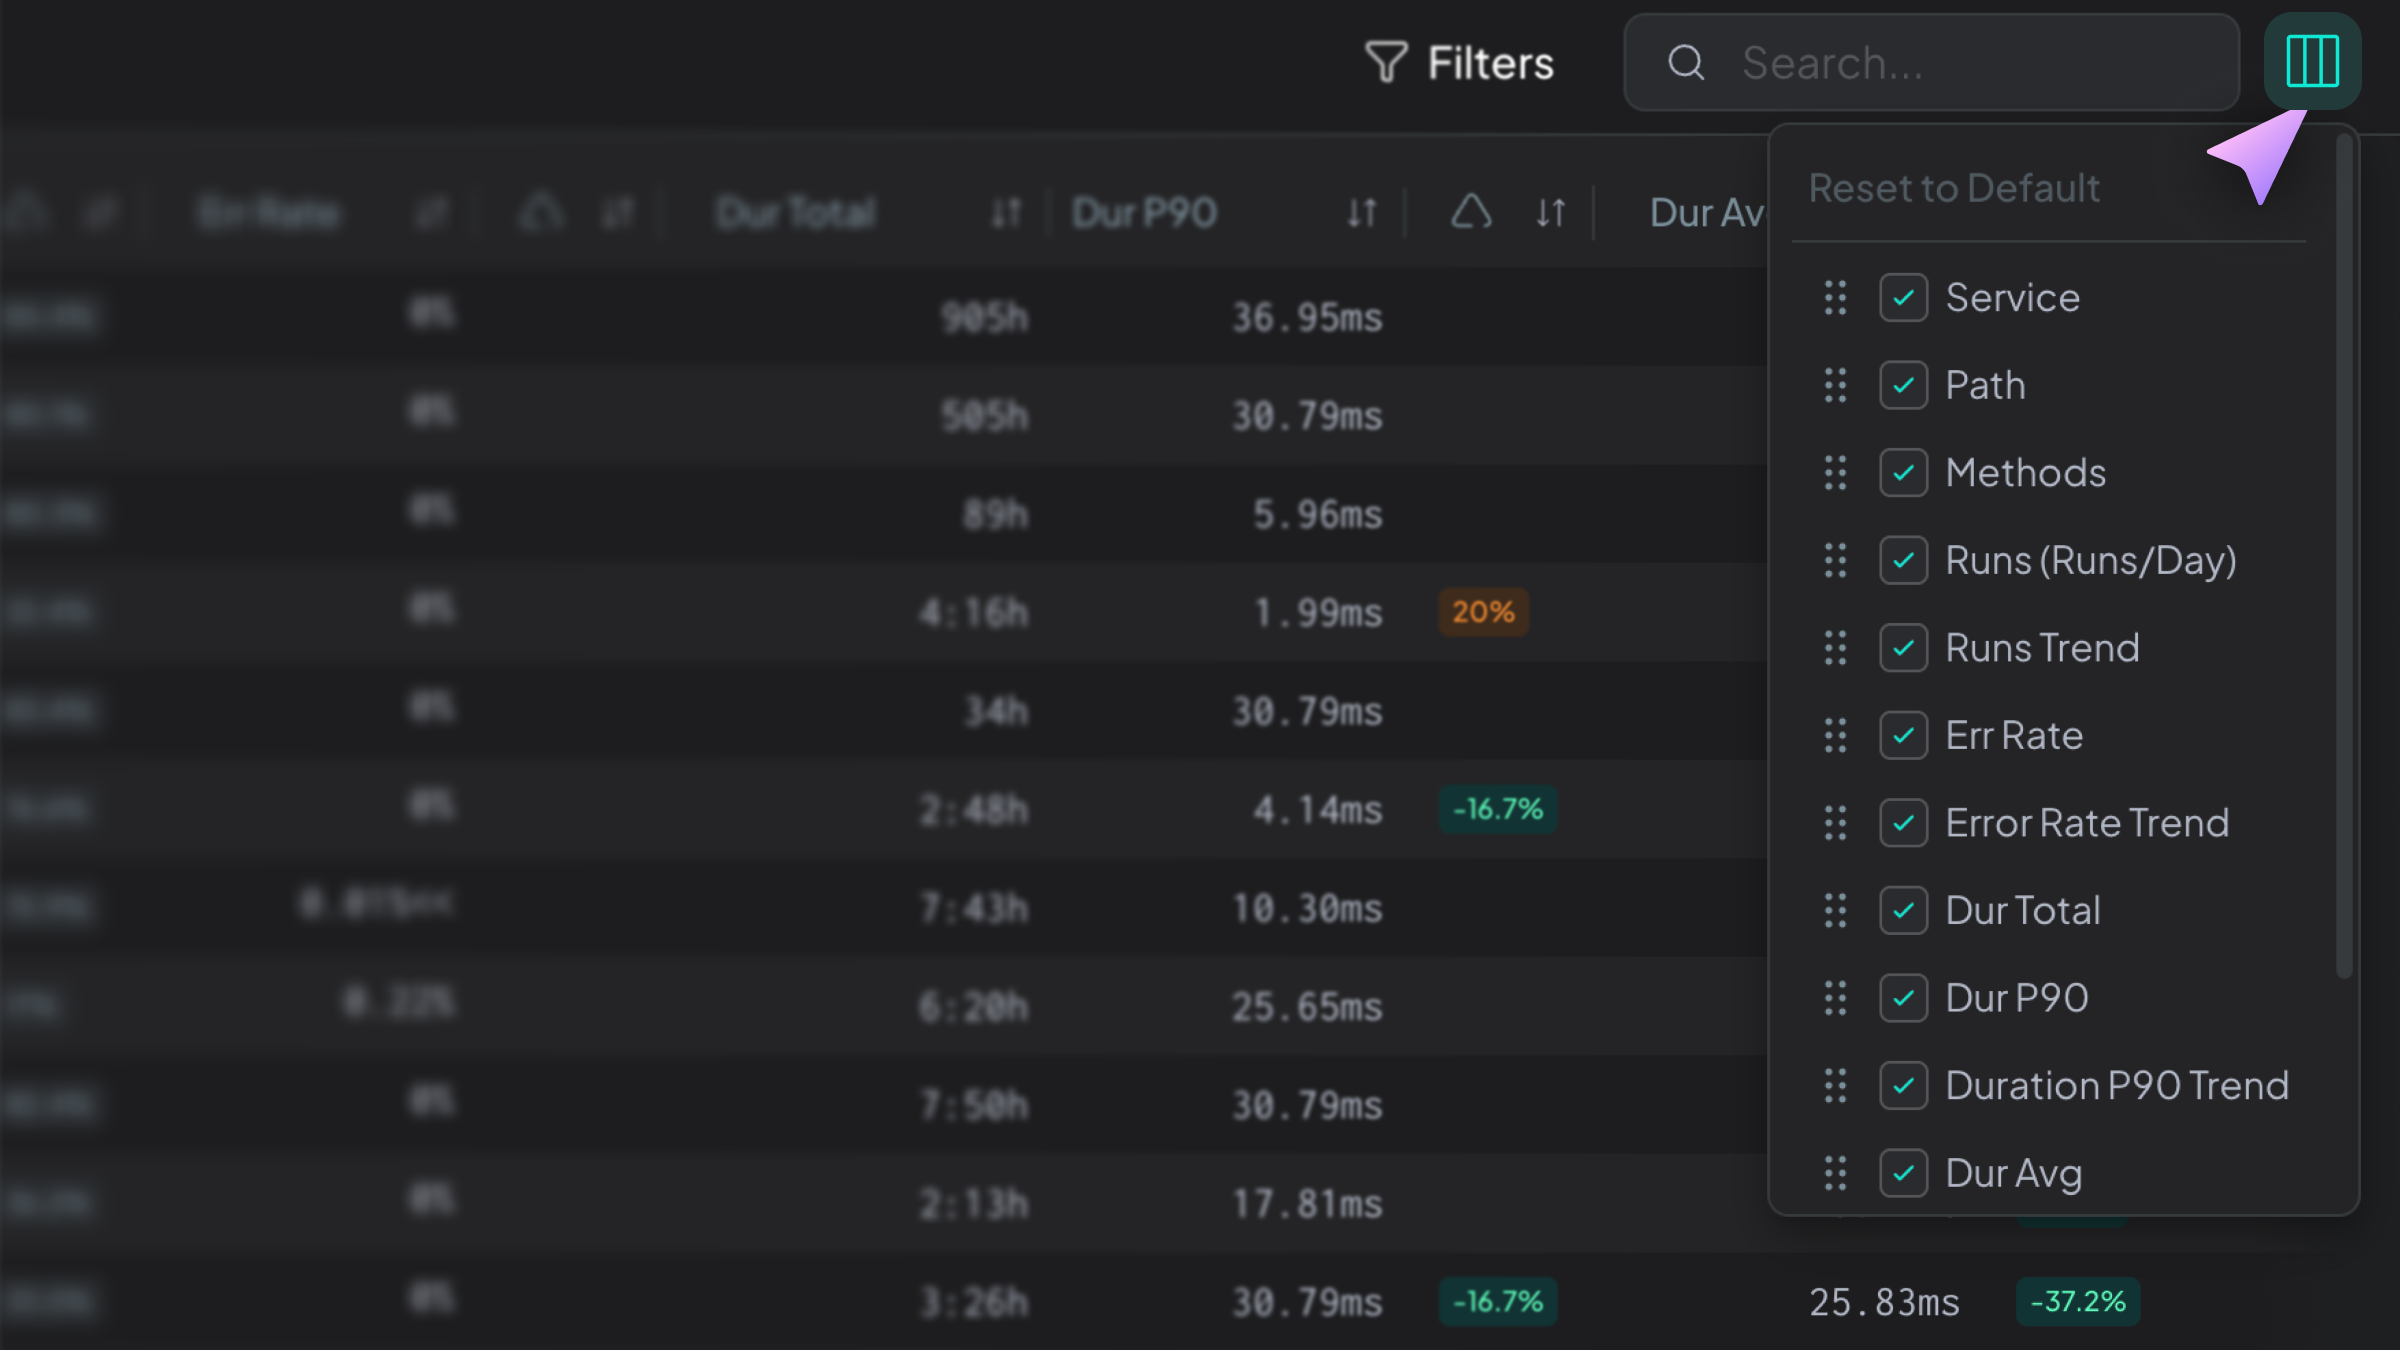
Hud now includes a Total Duration metric across Functions, Endpoints, and Queues, making it easier to see which parts of your system consume the most cumulative time.

Why It Matters

Avg Duration shows slowness and Invocations show volume, but neither reflects true impact. Total Duration combines both, helping teams quickly identify the entities that account for the most total time and are the best candidates for optimization.

How to Access

Open any Functions, Endpoints, or Queues table in Hud Web and enable sorting on the Total Duration column.

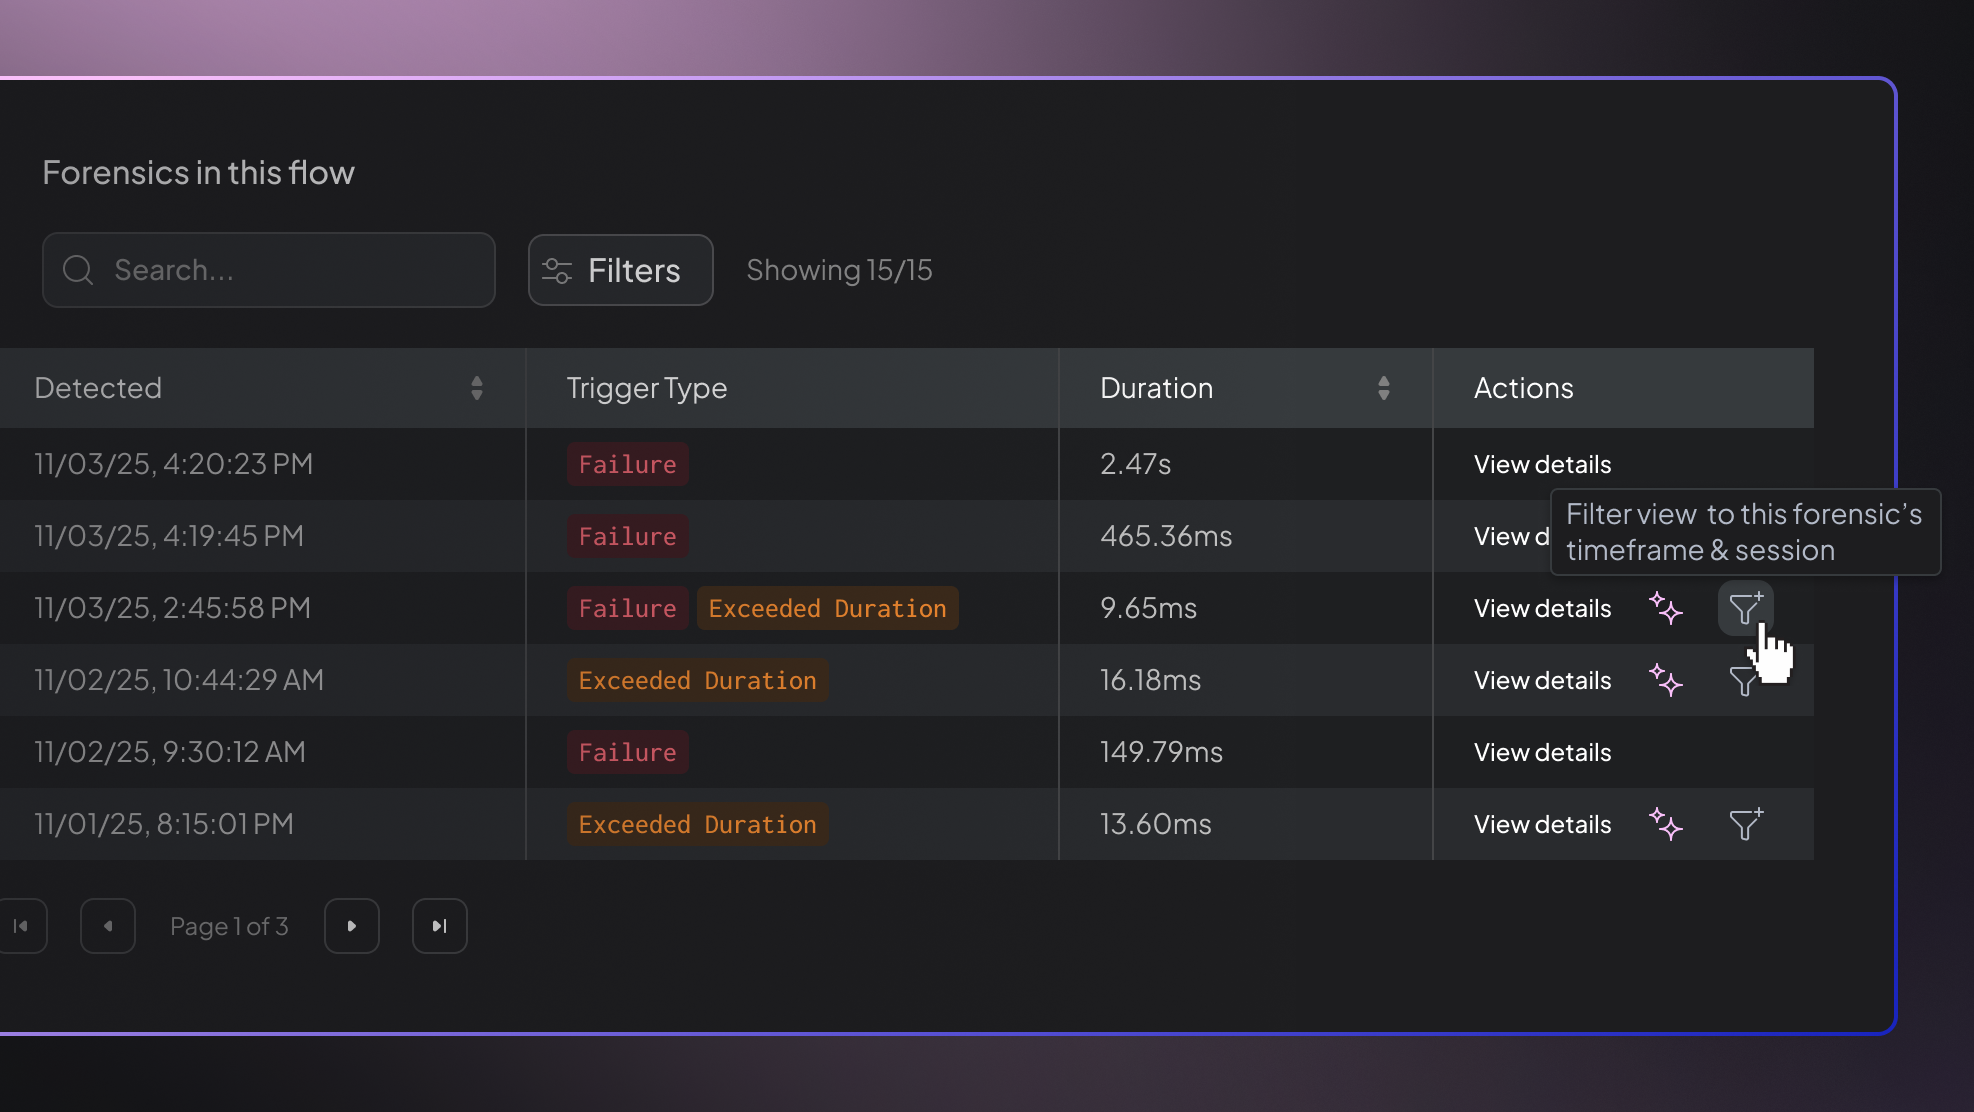
You can now filter the entire flow by the session and timeframe of a forensic sample, making it easier to understand what happened during a specific performance outlier.

Details

Hud now includes a Filter by this forensic action on performance forensic samples. When applied, Hud automatically sets the global timeframe to the forensic window and filters the “Functions in this flow” table by the relevant session ID. Navigation is session-aware, so clicking into any function keeps the same session filter applied as you move through the flow.

Why It Matters

Performance regressions often impact only a single session. Filtering the app to match the exact session and timeframe of the outlier removes noise and helps teams focus on the precise operations that caused the slowdown.

How to Access

Open any Performance Forensics sample and select Filter by this forensic. The flow and functions data will immediately update to reflect that specific session.


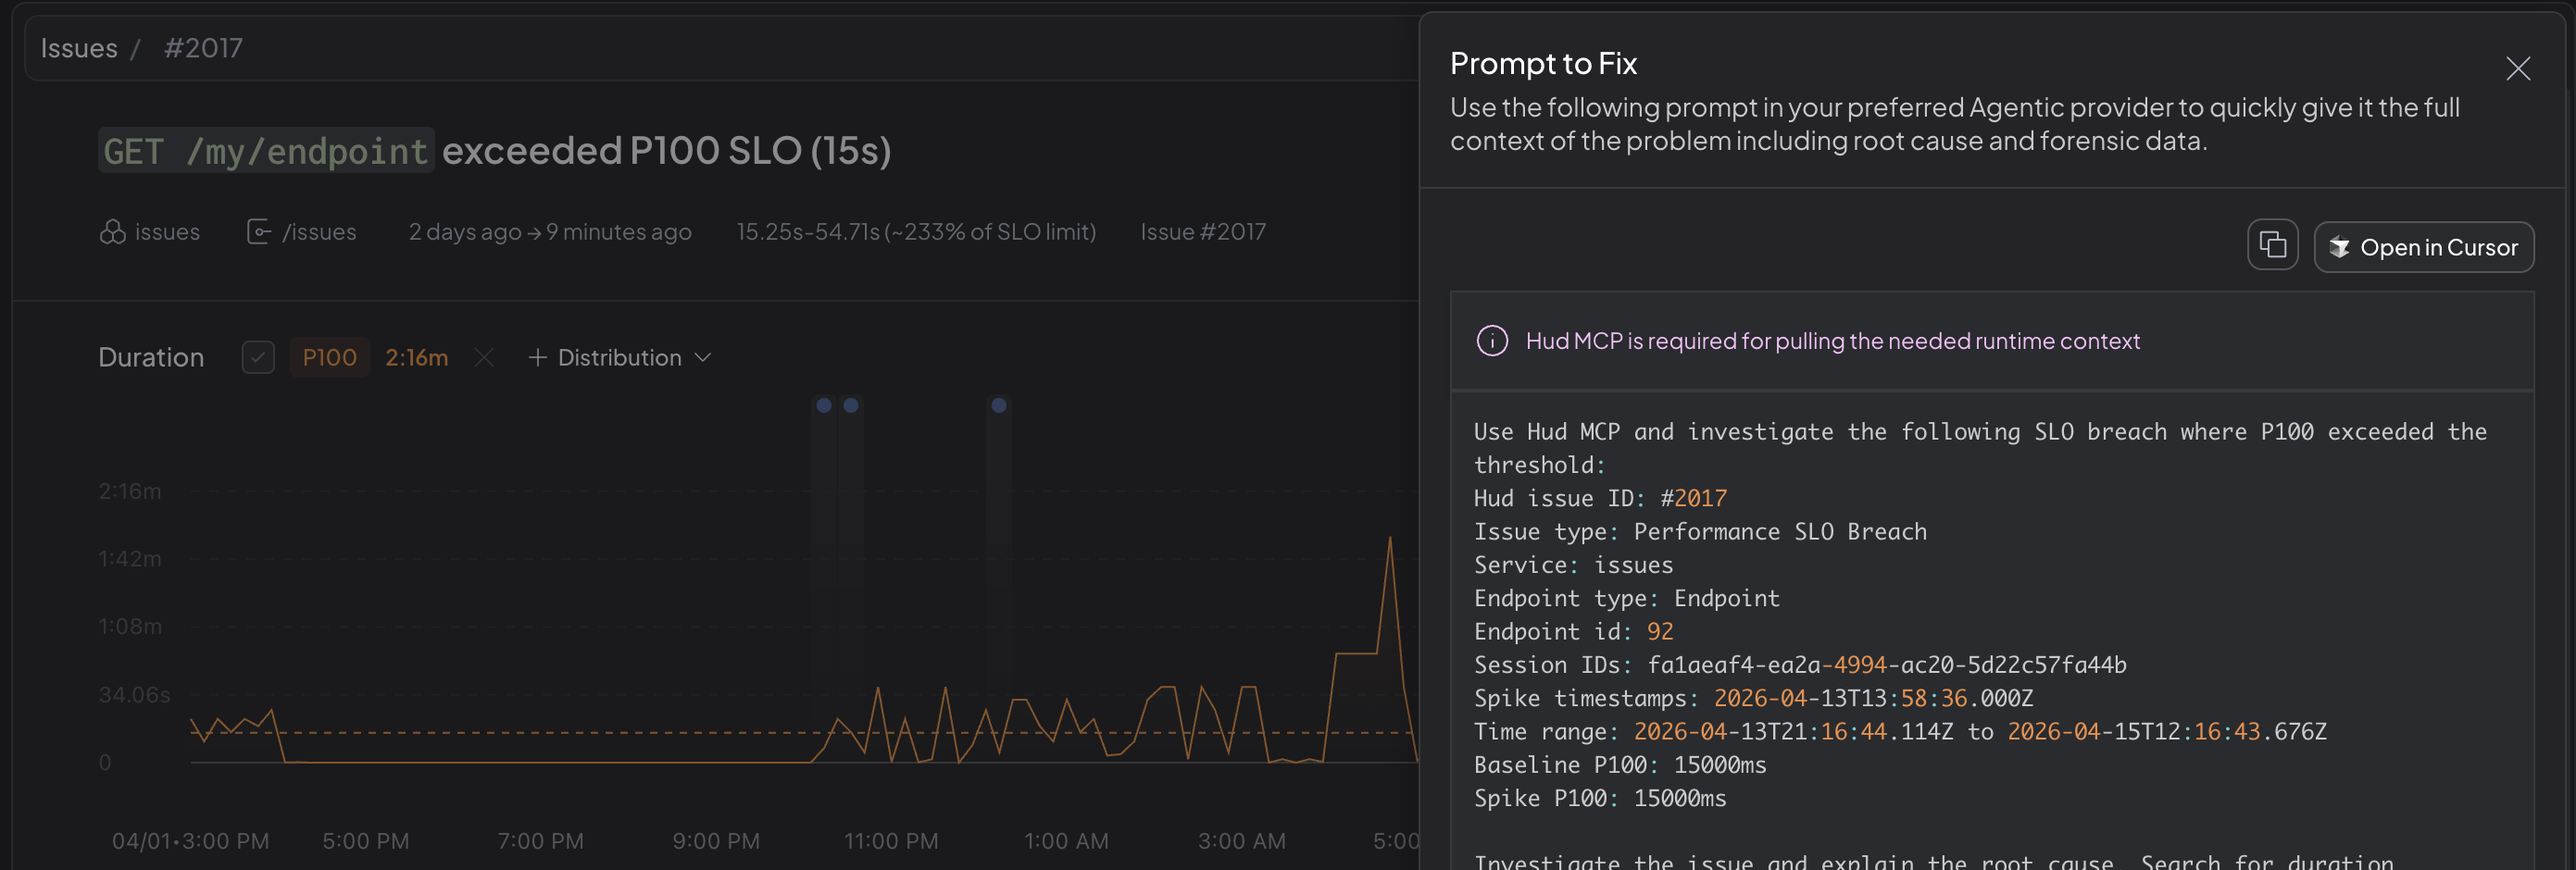
You can now turn any duration outlier sample into a ready-to-use investigation prompt for your code agent, helping you move from evidence to action faster.

Details

The Forensics table now includes a new “Prompt to Fix” option for duration outlier samples. Each prompt is prebuilt to describe the issue and provide a clear task for your agent. When used with Hud MCP, the prompt includes the runtime context needed for the agent to investigate the root cause and propose a fix. This feature currently supports forensic samples captured as duration outliers.

Why It Matters

Duration outliers often signal hidden performance problems. Having an actionable prompt lets you immediately investigate with full context instead of starting from scratch.

How to Access

Open any endpoint or queue in Hud Web, scroll to the Forensics table, select a duration-based sample, and click “Get Prompt to Fix”. Paste the generated prompt into Cursor with Hud MCP enabled.


Feature requires the “Duration Forensics” capability enabled by the customer operations team.

You can now filter Hud MCP tools by a specific session, letting you inspect metrics for a single pod or host and compare them to the overall baseline.

Details

The new service_session parameter in Hud MCP lets you zoom in on one pod or host and view metrics only for that session. Each metric includes a diff against the baseline, making it easy to see where values differ and by how much.

Why It Matters

Many regressions appear only in specific pods. Filtering by session helps you isolate pod-level issues quickly and understand how local behavior deviates from normal traffic.

How to Access

In your IDE, run any Hud MCP tool with a session ID. You can copy a session ID directly from any Forensics sample which is in Hud's Webapp.

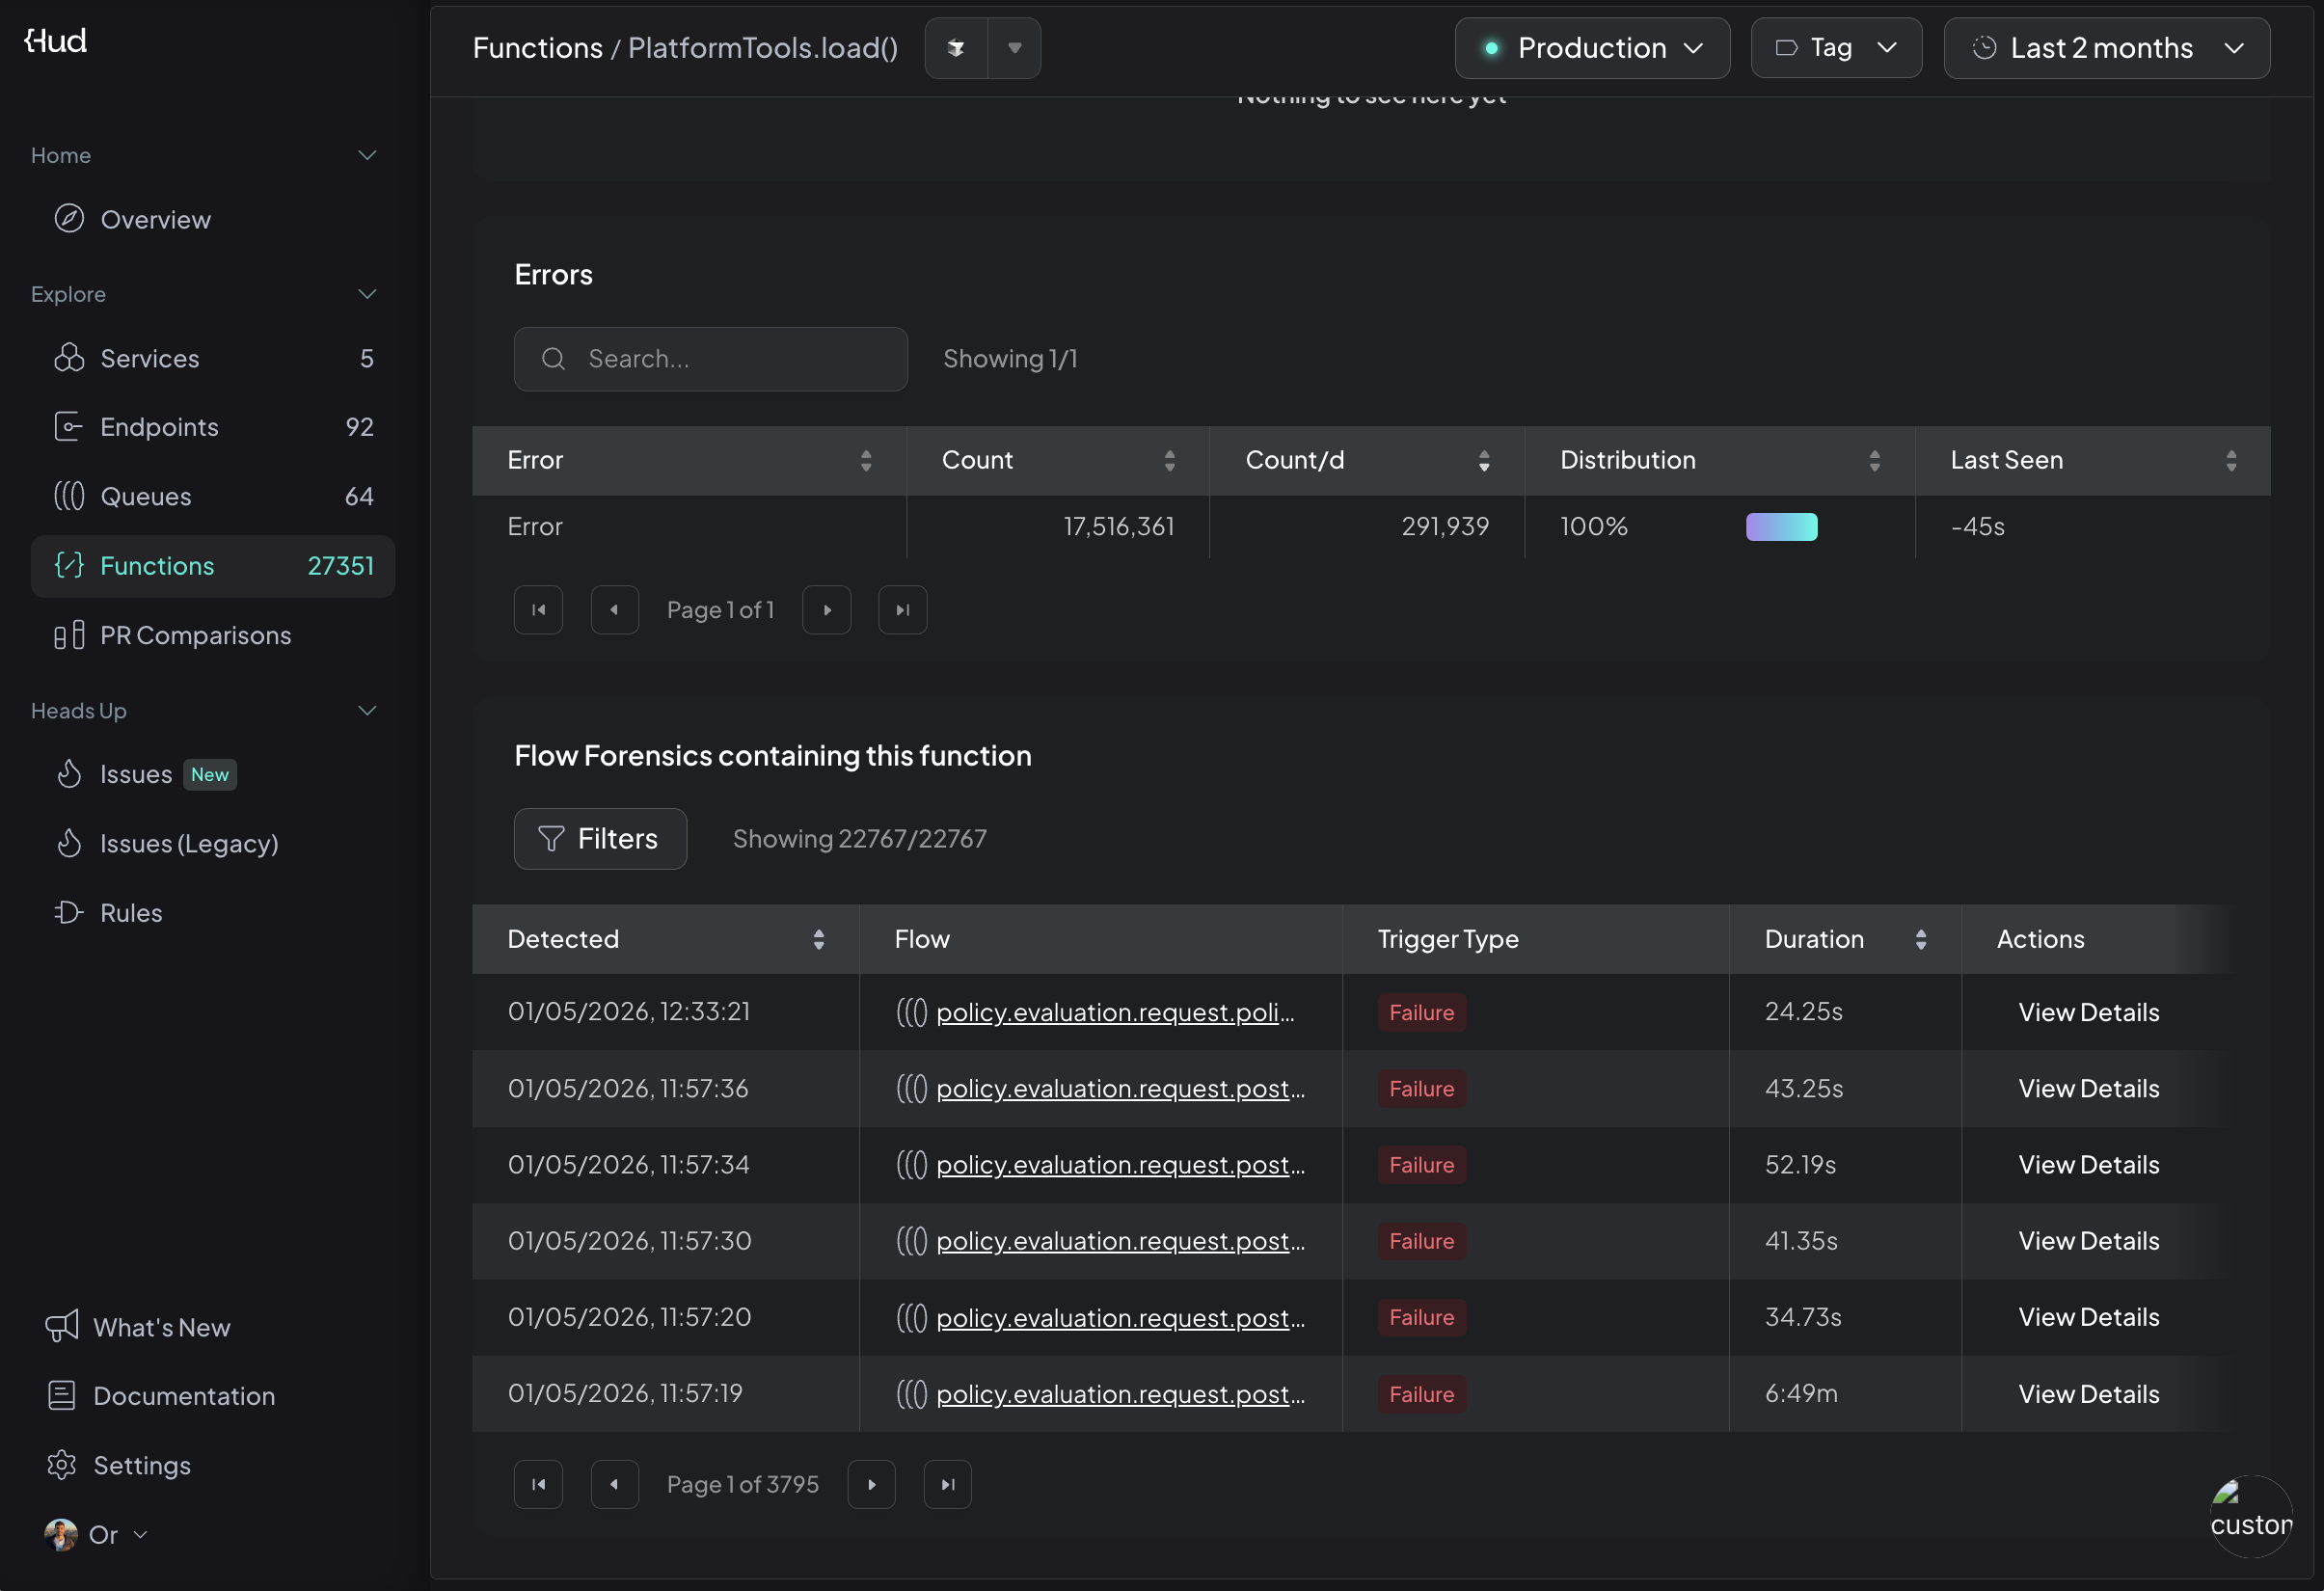
Hud now surfaces forensic samples directly on endpoint and queue pages, helping you move from high-level signals to concrete evidence with fewer clicks.

Details

A new "Forensics in this flow" table appears on all endpoint and queue pages. It lists sampled runs captured when Hud detects unusual behavior, including failures and duration-based triggers such as Exceeded Duration. Each entry shows detection time, trigger type, and run duration, making it easy to spot patterns. Selecting a row opens the full forensic view for that specific run.

Why It Matters

You can quickly validate anomalies, inspect real execution data, and get to root causes faster without navigating away from the flow you're investigating.

How to Access

Open any endpoint or queue in the Hud Web App and scroll to the Forensics section to review recent samples.


Hud now detects new or sharply increased errors immediately after each deployment, helping you validate stability and identify regressions within minutes.

Details

This update adds automatic detection of sudden error spikes following a deploy. Hud correlates each issue to the deployed version, highlights likely root-cause functions, and distinguishes between new errors and increased existing ones across endpoints and queues. Alerts are delivered across Web, Slack, and MCP, all with deploy time context.

Why It Matters

This closes the loop between deployment and detection. You can immediately see whether a release introduced failures and understand where they originated.

How to Access

Deploy your latest version and Hud will automatically monitor affected endpoints and queues.

Post-deploy alerts require Node SDK v1.6.28+ or Python SDK v0.3.20+.


Hud now captures and analyzes GraphQL operations with the same visibility and workflows available for REST, so teams using GQL get full monitoring parity across the Hud Web App and MCP.

Details

Hud automatically tracks GraphQL operations and displays them in the Endpoints list and MCP tools. Each operation is identified by its operation name, and the method reflects the operation type (query, mutation, subscription). Metrics, trends, flows, and alerts all work the same way as they do for REST endpoints. Errors are detected from response bodies and failure messages to ensure accurate issue tracking.

Why It Matters

Teams using GraphQL can monitor performance, errors, and regressions with the same depth and reliability they expect from Hud's REST support.

How to Access

Update to Node SDK version 1.6.36+ and send a few GraphQL requests. Your operations will appear automatically in the Hud Web App and MCP.

Hud now adds P99 and P50 duration metrics across Web graphs and MCP, giving teams clearer visibility into both typical behavior and extreme slowdowns.

Details

Duration charts now include P99 and P50 in addition to Avg and P90. These metrics are available across Issues, Endpoints, Queues, and Functions. The default view remains Avg and P90, and you can toggle P50 and P99 when deeper analysis is needed. This helps distinguish rare outliers from meaningful performance regressions.

Why It Matters

You get a more complete view of real production performance, allowing you to prioritize issues that impact users and improve reliability with confidence.

How to Access

Open any performance graph in the Hud Web App to toggle P50 and P99, or ask your agent to display these metrics in Hud MCP.


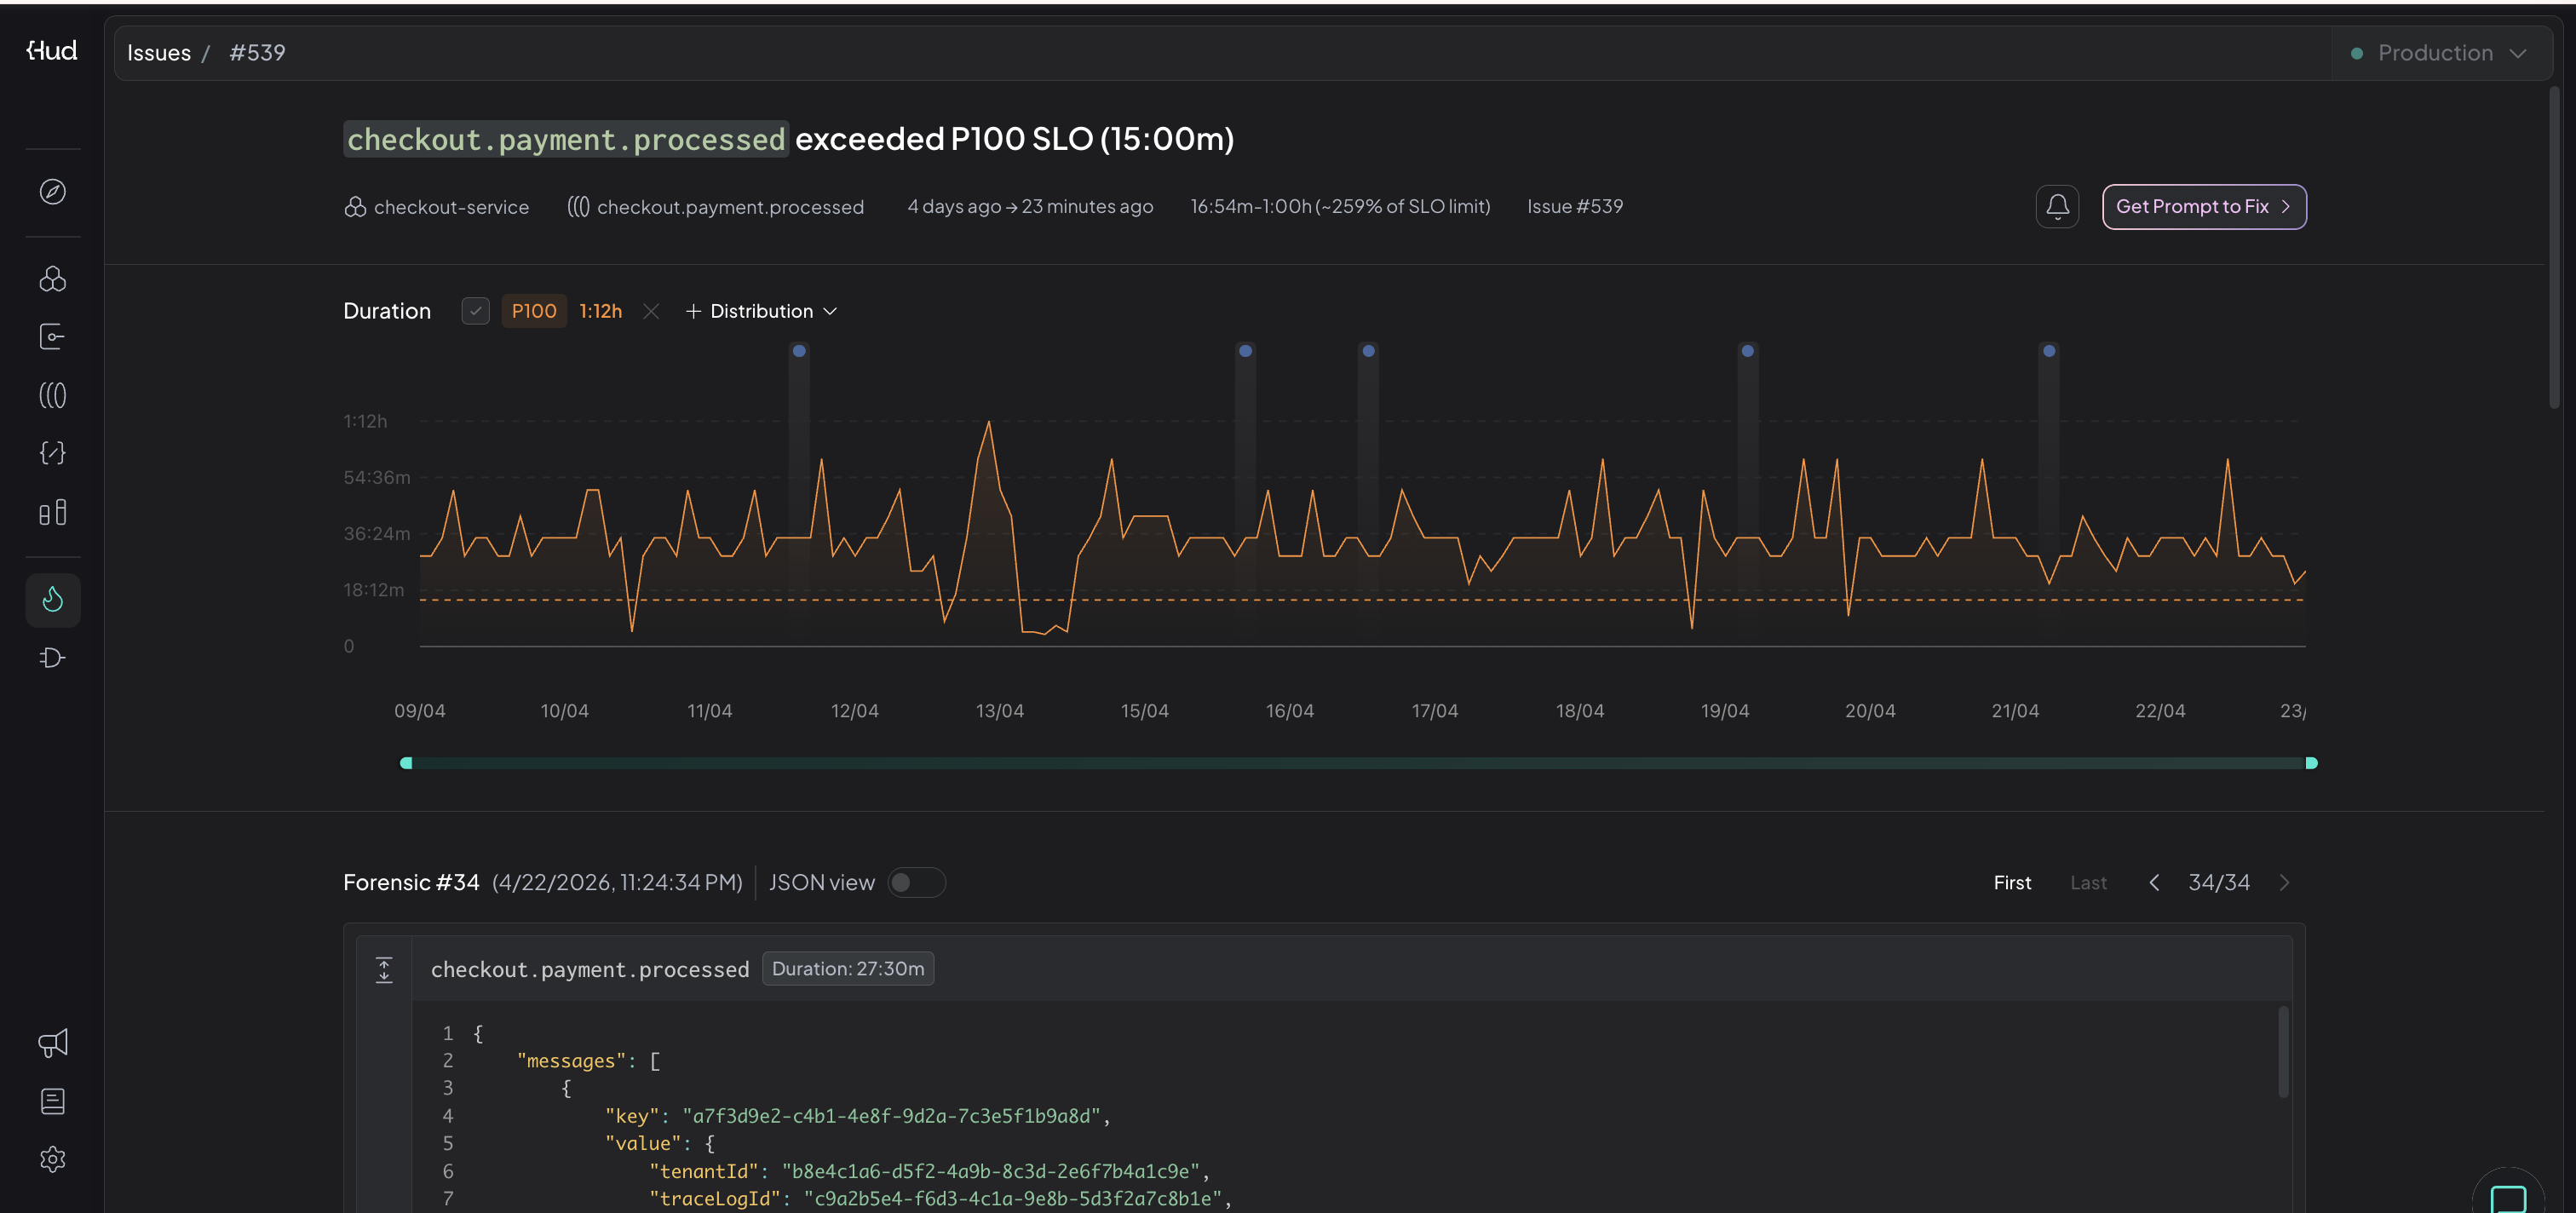
Hud's new Issues mechanism groups related events into persistent, lifecycle-tracked issues, giving teams clearer context, fewer alerts, and a more accurate view of what is happening in production.

Details

Hud now assigns stable IDs to issues, allowing each problem to be tracked from first detection through resolution. Related errors - such as HTTP 500s caused by the same underlying exception - are grouped into a single issue instead of separate alerts. The new Issues Dashboard brings these signals together across services, with filters and forensic data to help teams investigate faster. Auto-labels highlight first-time issues, spikes in error rates, and regressions tied to recent deployments. Slack alerts now fire once per issue, reducing noise while preserving visibility.

Why It Matters

By consolidating related errors into a single, persistent issue, teams gain a clearer picture of root causes, reduce alert fatigue, and accelerate time to resolution.

How to Access

Use the Issues Dashboard in Hud Web to explore and manage active issues. New grouping and alerting behavior is available immediately for projects running Node SDK v1.6.28+ or Python SDK v0.3.20+.