
What You Can Do with Hud
Welcome to Hud!
Hud is a platform that alerts engineers to production problems before they impact customers—pinpointing the root causes with the context needed to fix them, straight in the IDE. Hud detects errors, degradations, and slowdowns in real time, instantly linking business problems to their exact code-level causes - to help engineers detect and resolve production issues faster.
Your company services are already integrated with hud, so let’s get started!
Getting started
You can use Hud in your IDE and on the web. We recommend first installing Hud’s IDE extension:
- VSCode or Cursor: search for “Hud” in the extension tab or download from here.
- Jetbrains Suite (e.g. Webstorm): search for Hud in the extension tab or download from here.
Once you have the extension installed and logged in, go to https://app.hud.io - that’s it!
What you can do with Hud
Here are a few things you can do with Hud:
- Fix bugs faster: navigate from endpoint issue to root cause
- Detect production issues with root cause already figured out
- Write production-aware code
In the following sections we’ll go over using Hud’s features to achieve the above.
For more information about integrating Hud into additional service, click here.
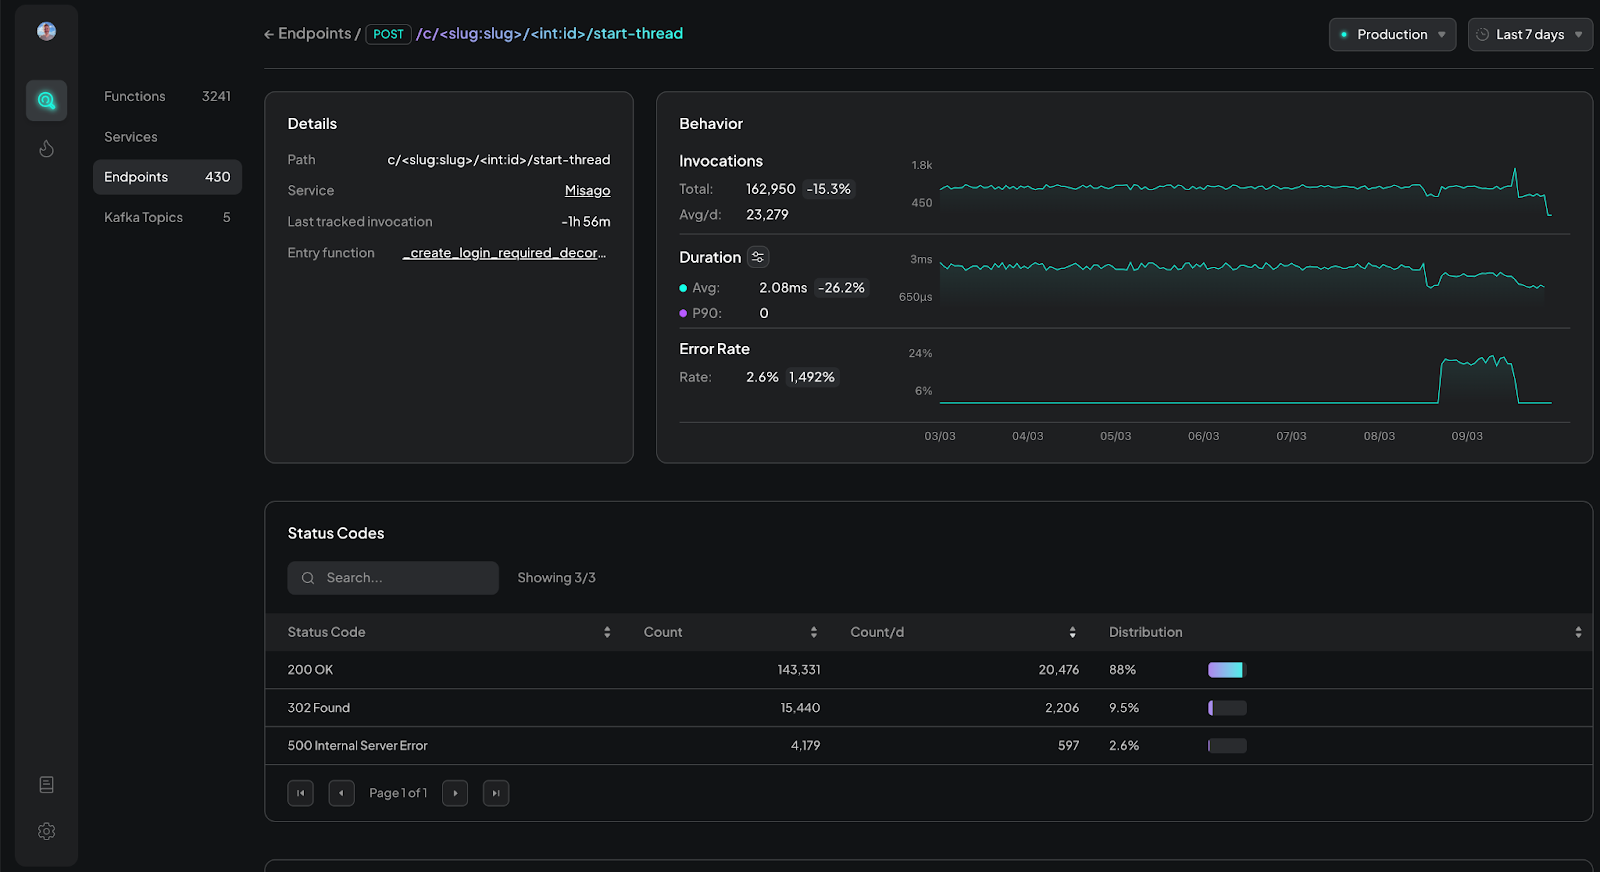
Fix Bugs Faster: Navigate From Endpoint Issue to Root Cause
Navigate from endpoint errors to root causes through production-aware call graphs.
- Go to the endpoints tab.
- Sort the list by error rate and click one of the endpoints with errors
- Use the timeframe selector to filter a specific timeframe with an error.
- Select the “Entry function” to view the handler function of the endpoint.
- Go to the function’s page, view the exception type at the Errors table and use the Callees table to find any
- callees that might throw an exception to the current function.
- Follow the call graph until you identify the function responsible for the error. Hop straight into your code (by using the VSCode logo deeplink at the top of the function page) and fix your bug.
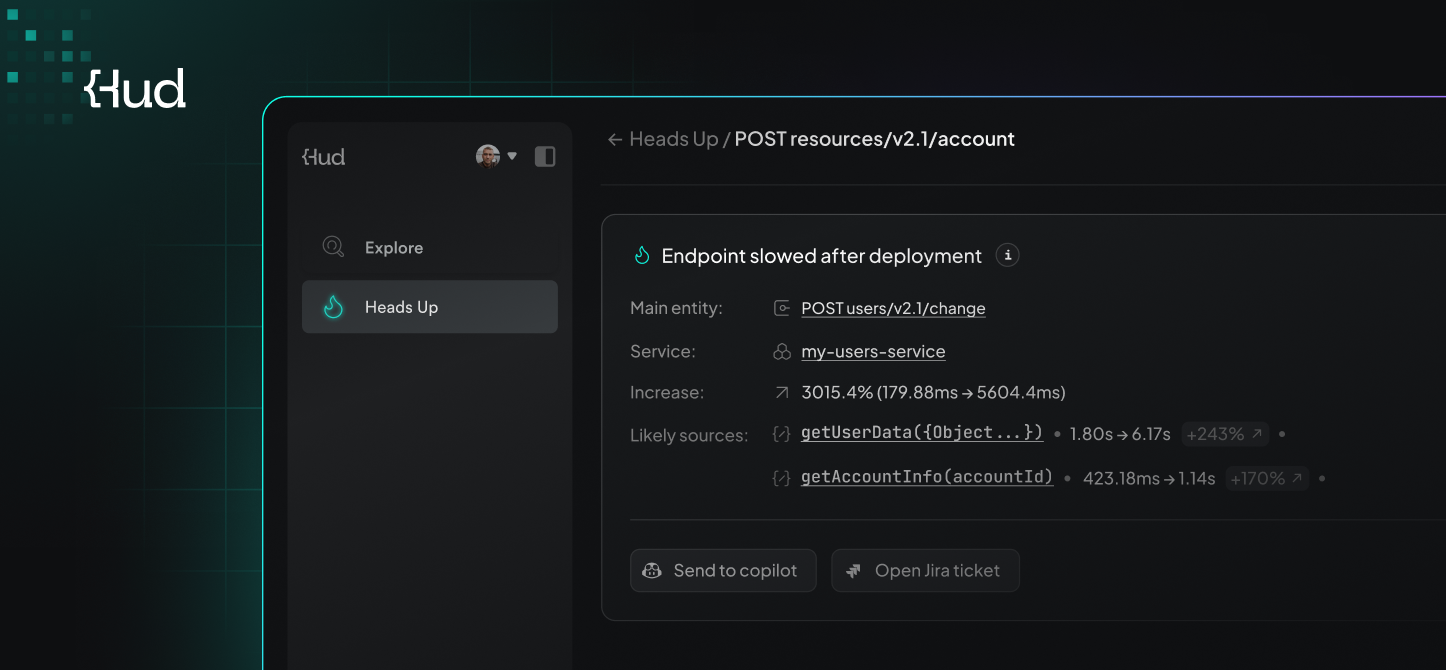
Detect production issues with root cause already figured out
Get notified on issues in your production environment, with alerts directing you straight to the root causes with the context needed to fix them. There’s no need to configure Hud, alerts are automatically served on the web and in the IDE (and if desired - in dedicated Slack channels).
Alerts type examples:
- Post deployment – Hud automatically tracks function and endpoint changes over time, comparing their behavior before and after deployments, detecting errors and degradations.
- HTTP 5XX – Hud detects and alerts you when HTTP endpoints return 500 error codes, with the root cause function that threw the relevant exception during request processing.
- New errors – Hud continuously monitors your production environment, detecting and alerting you to newly occurring error trends that have never happened before, so you can address them promptly.
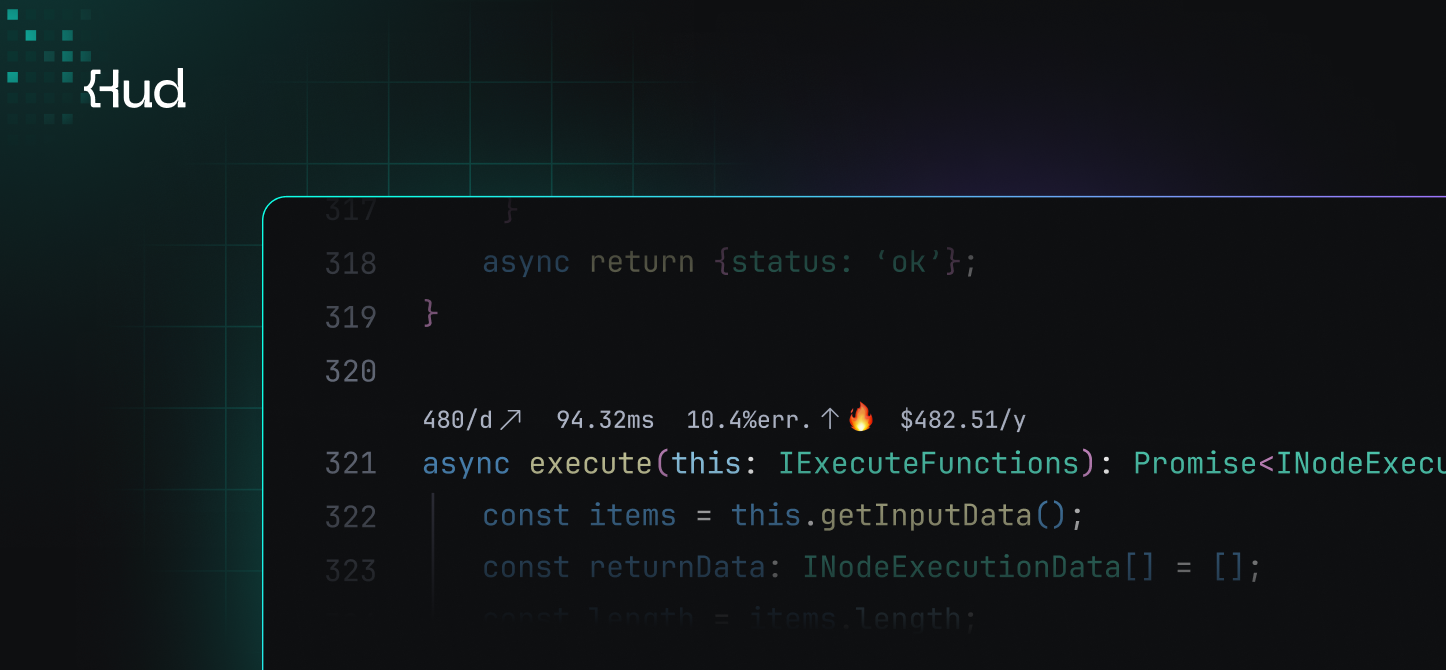
Write Production-Aware Code
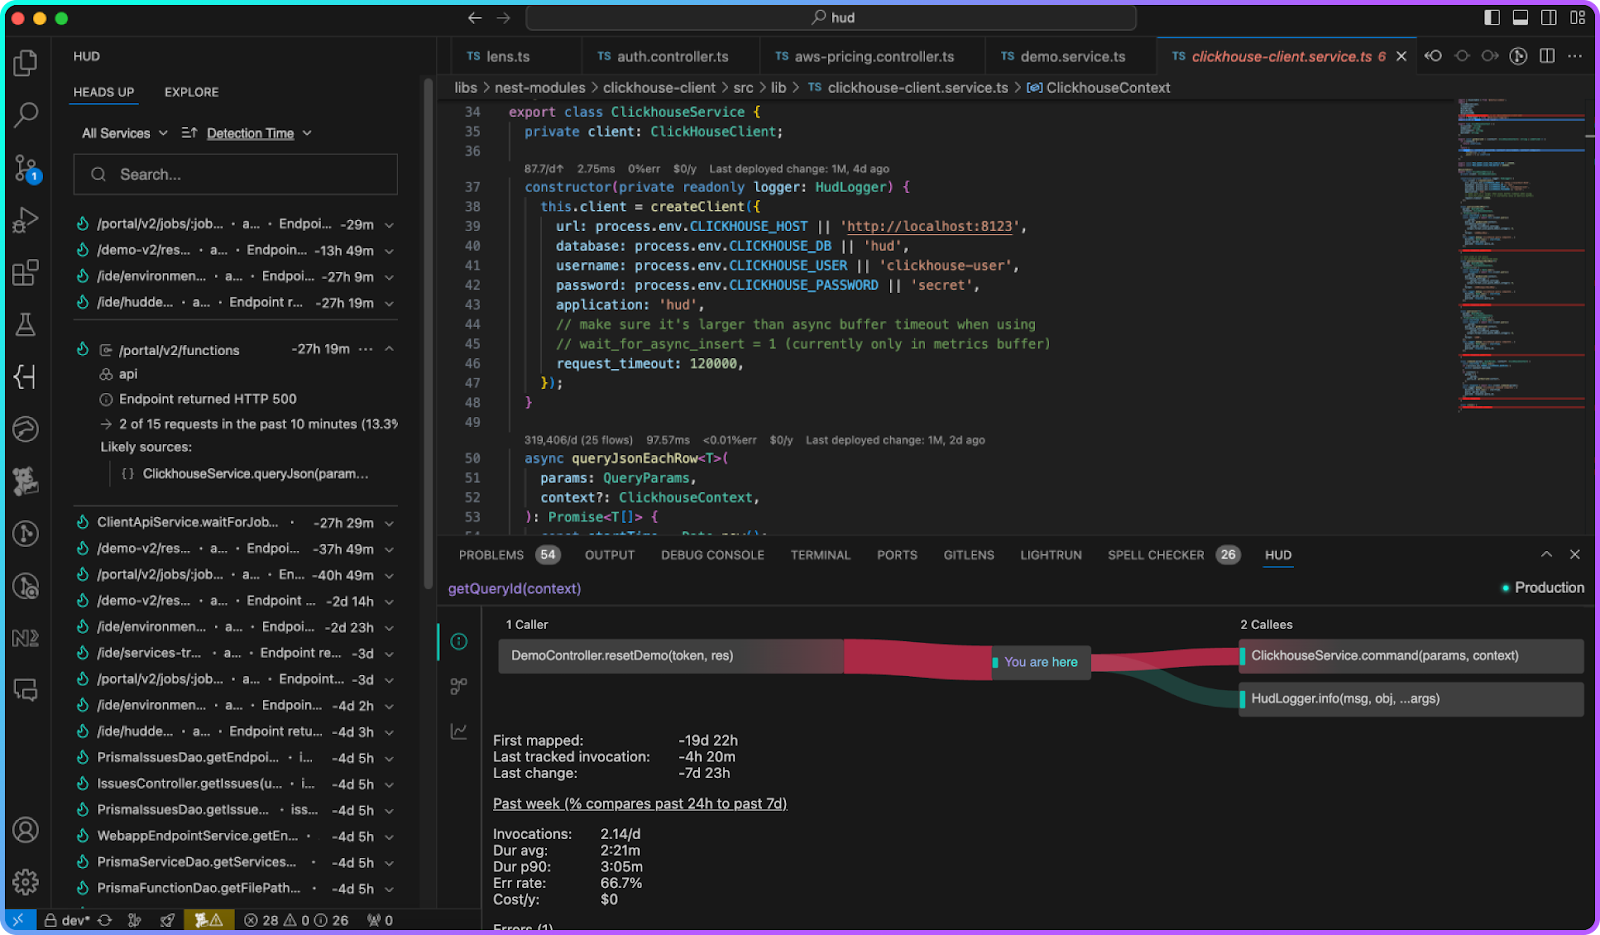
While coding, you can see real-time production data, such as call volumes, error spikes, and duration trends - in a header directly above each function in your IDE. We call those Hudders.
Click on a Hudder to reveal a detailed view of the function’s performance in production within the bottom panel, enabling you to see Callers and Callees functions’ call rate, performance and error rate. Click on a Caller or Callee to easily navigate within your code base.
Updated 5 days ago