
New Duration Distributions: P99 and P50
Hud now adds P99 and P50 duration metrics across Web graphs and MCP, giving teams clearer visibility into both typical behavior and extreme slowdowns.
Details
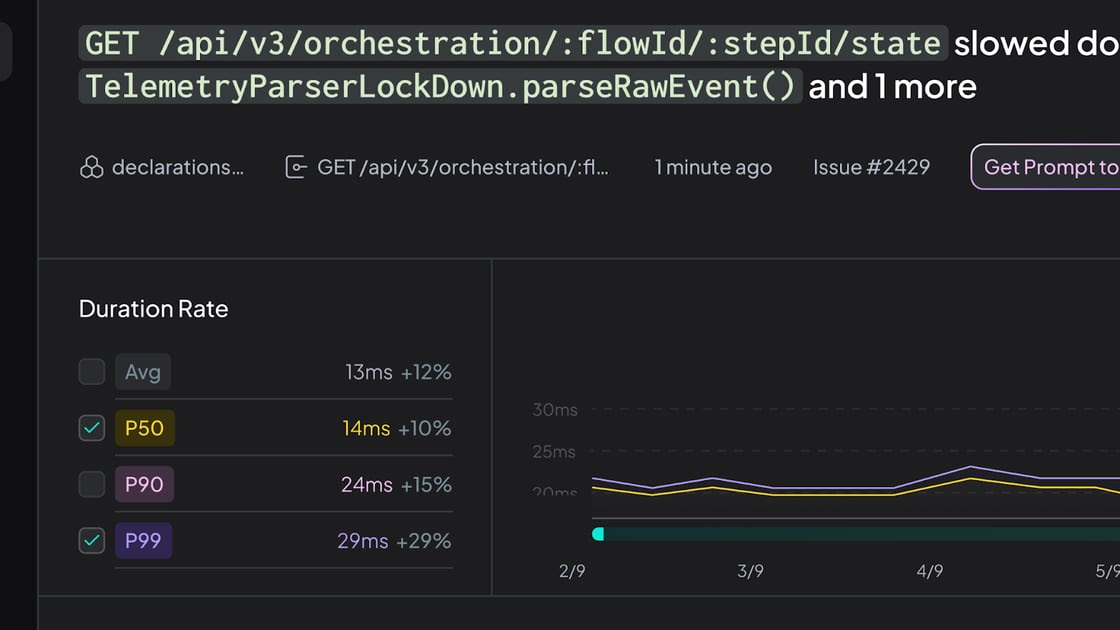
Duration charts now include P99 and P50 in addition to Avg and P90. These metrics are available across Issues, Endpoints, Queues, and Functions. The default view remains Avg and P90, and you can toggle P50 and P99 when deeper analysis is needed. This helps distinguish rare outliers from meaningful performance regressions.
Why It Matters
You get a more complete view of real production performance, allowing you to prioritize issues that impact users and improve reliability with confidence.
How to Access
Open any performance graph in the Hud Web App to toggle P50 and P99, or ask your agent to display these metrics in Hud MCP.