
Introducing Call Graph
September 8th, 2024
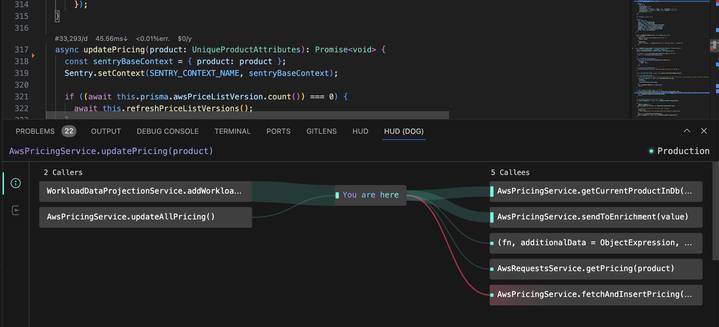
Meet Hud’s New Call Graph - A new way to understand your production flow.
Now, when clicking a Hudder, you’ll be able to see your function's callers and callees, based on production execution, and navigate in your code flow.
The graph can help you understand where your function is invoked from, what flow it affects, see top usages at the top, find likely root functions, and more.
Coming soon: Additional overlay information, improved design, and more new sections in the bottom panel.

New feature: call graph routes with significant exceptions.
We’ve added a new way to easily see and navigate flows that result in high error rates. Connections between functions with high exception rates will be marked in red on the call graph.
You can traverse the graph to find the root cause of the exceptions or examine the impacted top-level endpoint.