

New Overview Page
July 15th, 2025
We’ve launched a brand new Overview page to help you monitor and understand your services faster than ever.
What’s New
- High-level mapping summary: Instantly see how many endpoints, queues, and functions are mapped across your environment.
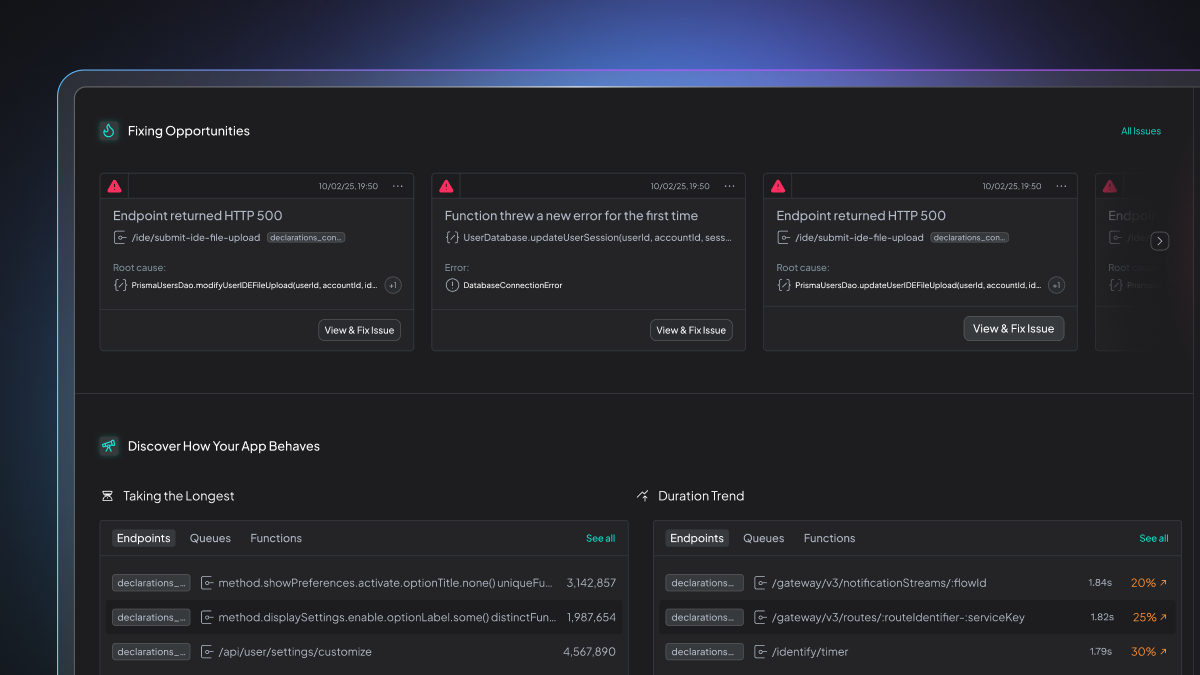
- Fixing Opportunities: Prioritized view of failing components with quick actions to create alerts or start an MCP investigation.
- Performance Insights:
- Slowest Components: Identify which endpoints or functions are taking the longest.
- Highest Error Rates: Spot stability issues with trending error data.
- Most Invoked: See what’s running most frequently in your stack.
Why It Matters
Whether you're debugging issues, tracking changes, or just trying to stay on top of your system's behavior - the Overview page gives you a unified starting point with actionable insights.
Available now for all environments. Go to Overview from the sidebar to explore.